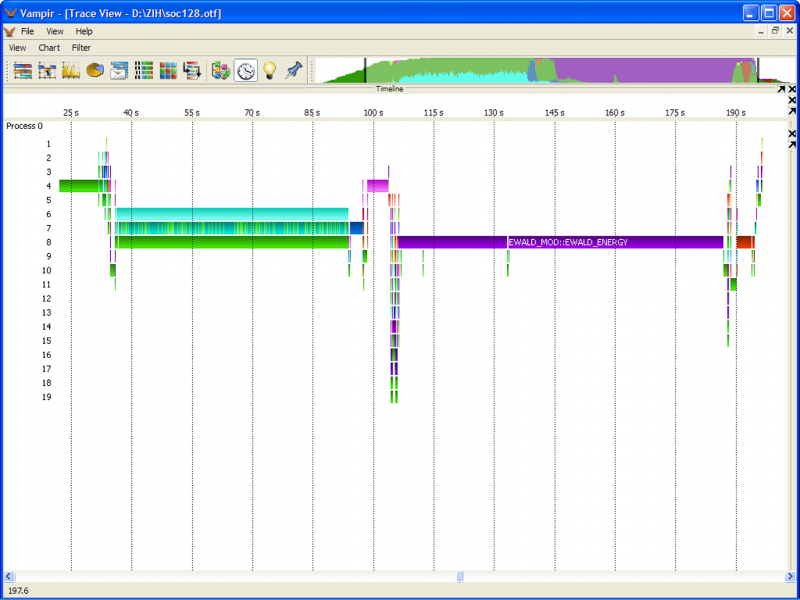
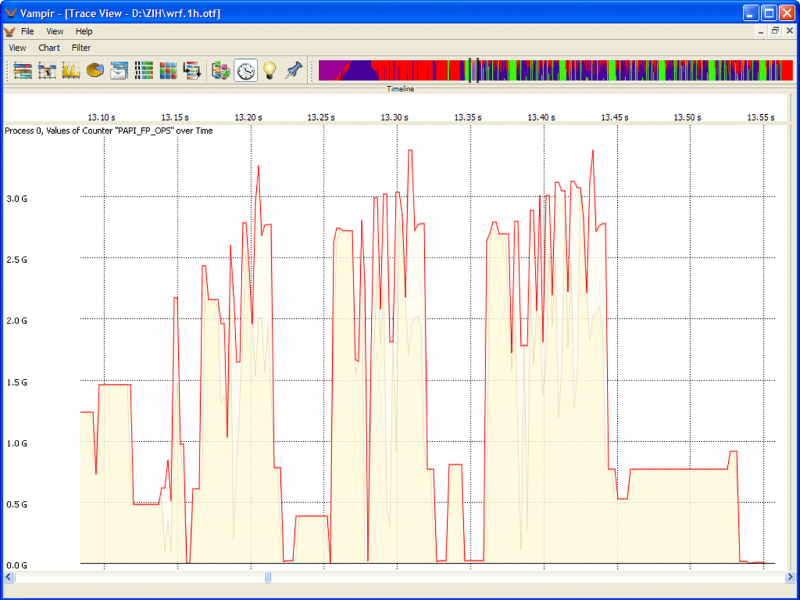
Vampir and Vampir Trace

Vampir

Introduction

Performance optimization is a key issue for the development of efficient parallel software applications. Vampir provides a manageable framework for analysis, which enables developers to quickly display program behavior at any level of detail. Detailed performance data obtained from a parallel program execution can be analyzed with a collection of different performance views. Intuitive navigation and zooming are the key features of the tool, which help to quickly identify inefficient or faulty parts of a program code. Vampir implements optimized event analysis algorithms and customizable displays which enable a fast and interactive rendering of very complex performance monitoring data. Ultra-large data volumes can be analyzed with a parallel version of Vampir, which is available on request. Vampir has a product history of more than 15 years and is well established on Unix-based HPC systems. This tool experience is now available for HPC systems that are based on Microsoft Windows HPC Server 2008. This new Windows edition of Vampir combines modern scalable event processing techniques with a fully redesigned graphical user interface.

Vampir on FutureGrid

VampirServer is currently available on India at /N/soft/x86_64/el5/india/vampirserver.  The VampirTrace modules are installed on Alamo, Hotel, India, and Sierra.  To load, type ‘module load vampirtrace’.

Event-based Performance Tracing and Profiling

In software analysis, the term profiling refers to the creation of tables which summarize the runtime behavior of programs by means of accumulated performance measurements. Its simplest variant lists all program functions in combination with the number of invocations and the time that was consumed. This type of profiling is also called inclusive profiling, as the time spent in subroutines is included in the statistics computation. A commonly applied method for analyzing details of parallel program runs is to record so-called trace log files during runtime. The data collection process itself is also referred to as tracing a program. Unlike profiling, the tracing approach records timed application events like function calls and message communication as a combination of timestamp, event type, and event specific data. This creates a stream of events, which allows very detailed observations of parallel programs. With this technology, synchronization and communication patterns of parallel program runs can be traced and analyzed in terms of performance and correctness. The analysis is usually carried out in a postmortem step, i. e., after completion of the program. Needless to say, program traces can also be used to calculate the profiles mentioned above. Computing profiles from trace data allows arbitrary time intervals and process groups to be specified. This is in contrast to fixed profiles accumulated during runtime.

The Open Trace Format (OTF)

The Open Trace Format (OTF) was designed as a well-defined trace format with open, public domain libraries for writing and reading. This open specification of the trace information provides analysis and visualization tools like Vampir to operate efficiently at large scale. The format addresses large applications written in an arbitrary combination of Fortran77, Fortran (90/95/etc.), C, and C++.

|images/otf_0.png| .. image:: images/otf_0.png

Representation of Streams by Multiple Files

OTF uses a special ASCII data representation to encode its data items with numbers and tokens in hexadecimal code without special prefixes. That enables a very powerful format with respect to storage size, human readability, and search capabilities on timed event records. In order to support fast and selective access to large amounts of performance trace data, OTF is based on a stream-model, i.e., single separate units representing segments of the overall data. OTF streams may contain multiple independent processes, whereas a process belongs to a single stream exclusively. As shown in the figure, each stream is represented by multiple files, which store definition records, performance events, status information, and event summaries separately. A single global master file holds the necessary information for the process to stream mappings. Each file name starts with an arbitrary common prefix defined by the user. The master file is always named {name}.otf. The global definition file is named {name}.0.def. Events and local definitions are placed in files {name}.x.events and {name}.x.defs, where the latter files are optional. Snapshots and statistics are placed in files named {name}.x.snaps and {name}.x.stats, which are also optional.

Note: Open the master file (*.otf) to load a trace. When copying, moving, or deleting traces, it is important to take all according files into account; otherwise, Vampir will render the whole trace invalid! Good practice is to hold all files belonging to one trace in a dedicated directory. Detailed information about the Open Trace Format can be found in the *Open Trace Format (OTF)* documentation.

Getting Started

The generation of trace files for the (Vampir) performance visualization tool requires a working monitoring system to be attached to your parallel program. Contrary to Windows HPC Server 2008 — whereby the performance monitor is integrated into the operating system — recording performance under Linux is done by a separate performance monitor. We recommend our VampirTrace monitoring facility, which is available as open source software. During a program run of an application, VampirTrace generates an OTF trace file, which can be analyzed and visualized by Vampir. The VampirTrace library allows MPI communication events of a parallel program to be recorded in a trace file. Additionally, certain program-specific events can also be included. To record MPI communication events, simply relink the program with the VampirTrace library. A new compilation of the program source code is only necessary if program-specific events should be added. Detailed information on the installation and usage of VampirTrace can be found at VampirTrace.

To perform measurements with VampirTrace, the application program needs to be instrumented. VampirTrace handles this automatically by default, while manual instrumentation is also possible. All the necessary instrumentation of user functions, MPI, and OpenMP events is handled by the compiler wrappers of VampirTrace (vtcc, vtcxx, vtf77, vtf90). All compile and link commands in the used makefile should be replaced by the VampirTrace compiler wrapper, which performs the necessary instrumentation of the program and links the suitable VampirTrace library. Automatic instrumentation is the most convenient method to instrument your program. Therefore, simply use the compiler wrappers without any parameters, e.g.:

vtf90 hello.f90 -o hello

For manual instrumentation with the VampirTrace API, simply include:

vt_user.inc (Fortran)

vt_user.h (C, C++)

and label any user defined sequence of statements for instrumentation as follows:

VT_USER_START(name) ... VT_USER_END(name)

in Fortran and C, respectively, and in C++ as follows:

VT_TRACER(``name);

Afterwards, use

vtcc -DVTRACE hello.c -o hello

to combine the manual instrumentation with automatic compiler instrumentation or

vtcc -vt:inst manual -DVTRACE hello.c -o hello

to prevent an additional compiler instrumentation.

Running a VampirTrace instrumented application should normally result in an OTF trace file in the current working directory where the application was executed. On Linux, Mac OS, and Sun Solaris, the default name of the trace file will be equal to the application name. For other systems, the default name is?*a.otf*?but can be defined manually by setting the environment variable VT_FILE_PREFIX to the desired name. After a run of an instrumented application, the traces of the single processes need to be unified in terms of timestamps and event IDs. In most cases, this happens automatically. If it is necessary to perform unification of local traces manually, use the following command:

vtunify <nproc>

If VampirTrace was built with support for OpenMP and/or MPI, it is possible to speed up the unification of local traces significantly. To distribute the unification on multiple processes, the MPI parallel version vtunify-mpi can be used as follows:

mpirun -np <nranks> vtunify-mpi <nproc>

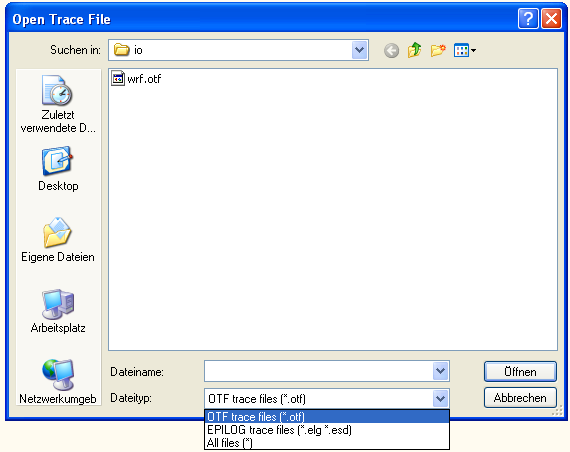
To open a trace file, from the “File” menu, select “Open...”. This will provide the file-open dialog depicted below. It is possible to filter the files in the list. The file type input selector determines the visible files. The default “OTF Trace Files (*.otf )” shows only files that can be processed by the tool. All file types can be displayed by using “All Files (*)”. Alternatively, on Windows, a command-line invocation is possible:

C:\Program Files\Vampir\Vampir.exe [trace file]

To open multiple trace files at once, you can take them one after another as command-line arguments:

C:\Program Files\Vampir\Vampir.exe [file 1]...[file n]

It is also possible to start the application by double-clicking on an *.otf file (if Vampir was associated with *.otf files during the installation process). The trace files to be loaded have to be compliant with the Open Trace Format (OTF) standard. Microsoft HPC Server 2008 is shipped with the translator program etl2otf.exe, which produces appropriate input files.

_images/open_file.png

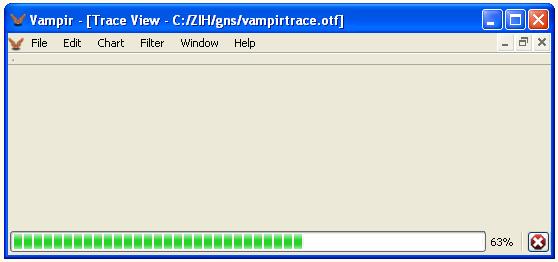
While Vampir is loading the trace file, an empty “Trace View” window with a progress bar at the bottom opens. After Vampir loaded the trace data completely, a default set of charts will appear. The illustrated loading process can be interrupted at any point of time by clicking on the cancel button in the lower right corner. Because events in the trace file are traversed one after another, the GUI will also open, but will show only the earliest information from the tracefile. For huge tracefiles with performance problems assumed to be at the beginning, this proceeding is a suitable strategy to save time.

_images/cancel_loading_resize.png

Basic functionality and navigation elements are described in?Basics. The available charts and the information provided by them are explained in?Performance_Data_Visualization.

Basics

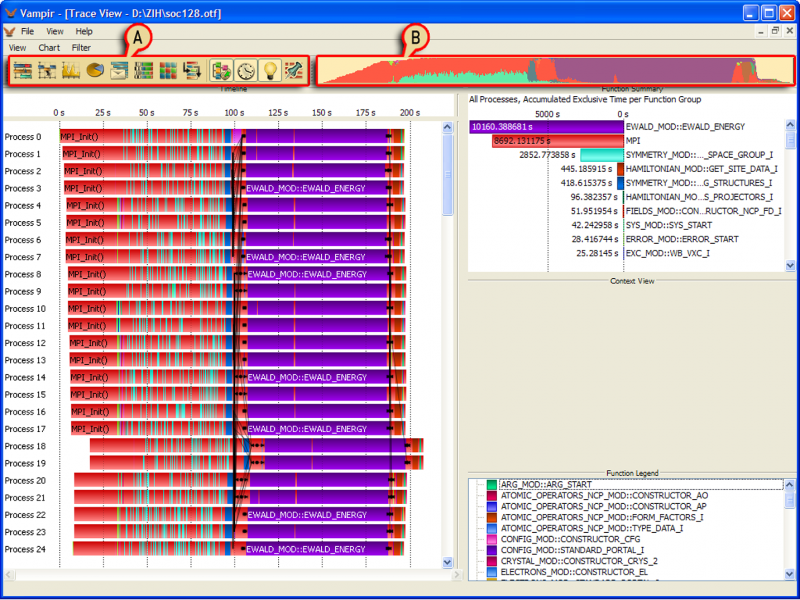
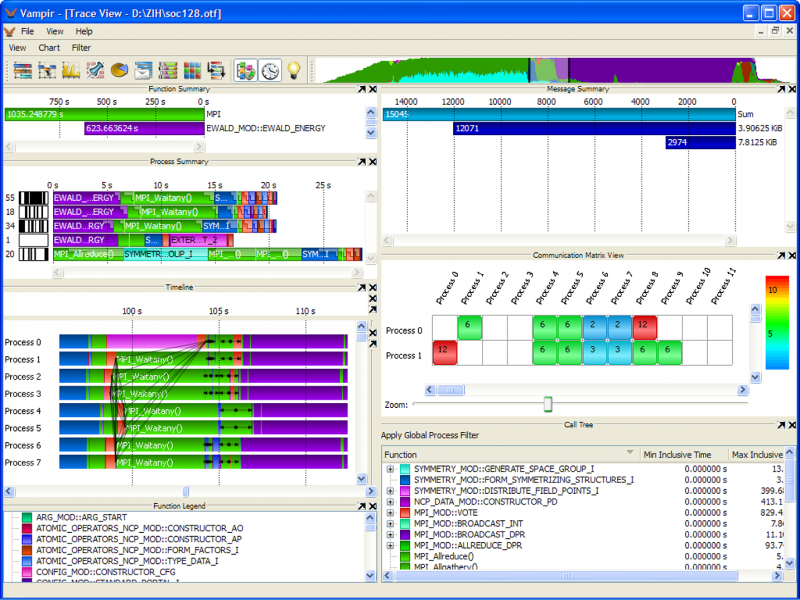
After loading has been completed, the Trace View?window title displays the trace file’s name. By default, the?Charts?toolbar and the?Zoom Toolbar?are available.

_images/Startup.png

Trace View Window with Charts Toolbar (A) and Zoom Toolbar (B)

Furthermore, the default set of charts is opened automatically after loading has been finished. The charts can be divided into three groups: timeline, statistical, and informational charts. Timeline charts show detailed event-based information for arbitrary time intervals, while statistical charts reveal accumulated measures computed from the corresponding event data. Informational charts provide additional or explanatory information regarding timeline and statistical charts. All available charts can be opened with the Chartstoolbar (explained in The Charts Toolbar). In the following section, we will explain the basic functions of the Vampir GUI which are generic to all charts.

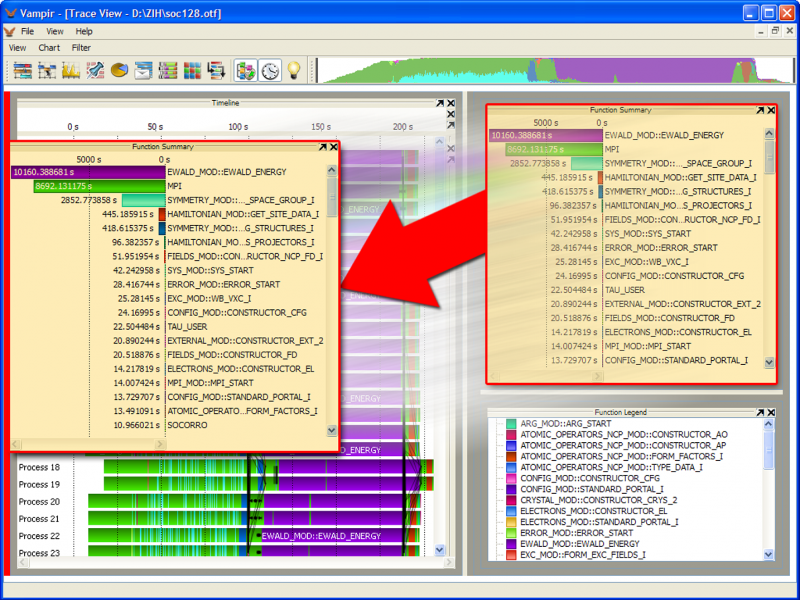
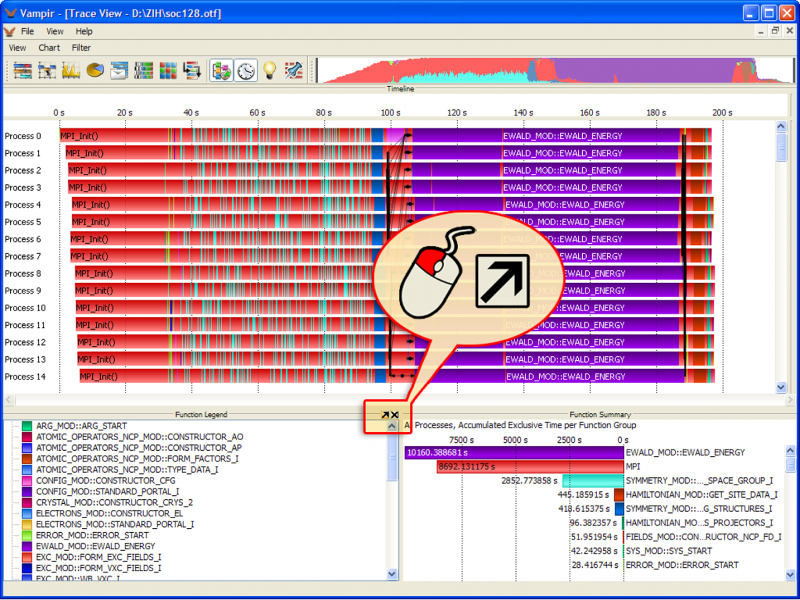
The utility of charts can be increased by correlating them and their provided information. Vampir supports this mode of operation by allowing you to display multiple charts at the same time. Charts that display a sequence of events such as the Master Timeline?and the?Process Timelinechart are aligned vertically. This alignment ensures that the temporal relationship of events is preserved across chart boundaries. The user can arrange the placement of the charts according to his preferences by dragging them into the desired position. When the left mouse button is pressed while the mouse pointer is located above a placement decoration, the layout engine will give visual clues as to where the chart may be moved. As soon as the user releases the left mouse button, the chart arrangement will be changed according to his intentions. The entire procedure is depicted in figures below. The flexible display architecture also allows increasing or decreasing the screen space that is used by a chart. Charts of particular interest may get more space in order to render information in more detail.

_images/Display_arranging_a.png

Moving and Arranging Charts in the Trace View Window

_images/Display_arranging_b.png

Moving and Arranging Charts in the Trace View Window

_images/Custom_arrangement.png

A Custom Chart Arrangement in the Trace View Window

_images/close_display.png

Closing (right) and Undocking (left) a Chart

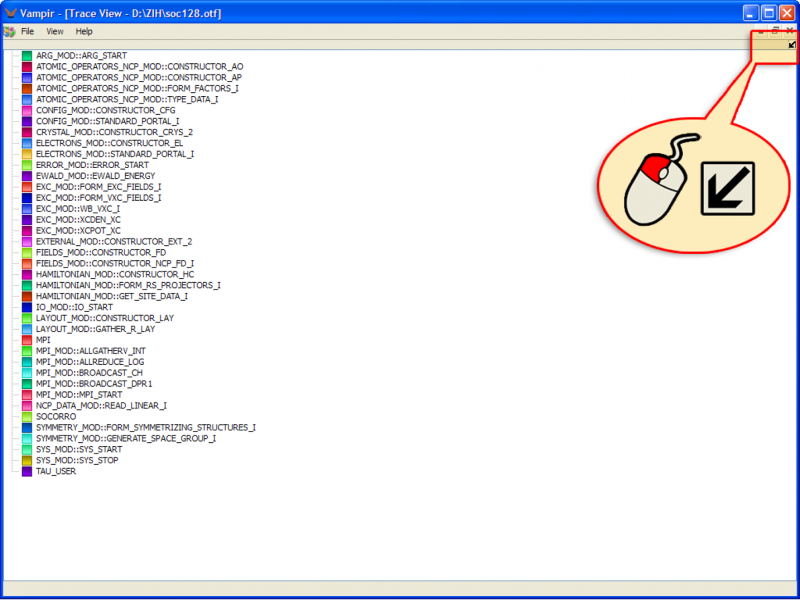
The?Trace View window can host an arbitrary number of charts. Charts can be added by clicking on the respective?Charts?toolbar icon or the corresponding?Chart?menu entry. With a few more clicks, charts can be combined to a custom chart arrangement. Customized layouts can be saved as described in?Saving Policy. Every chart can be undocked or closed by clicking the dedicated icon in its upper right corner. Undocking a chart means to free the chart from the current arrangement and present it in its own window.

_images/Undocking_1.png

Undocking of a Chart

_images/Undocking_2.png

Docking a Chart

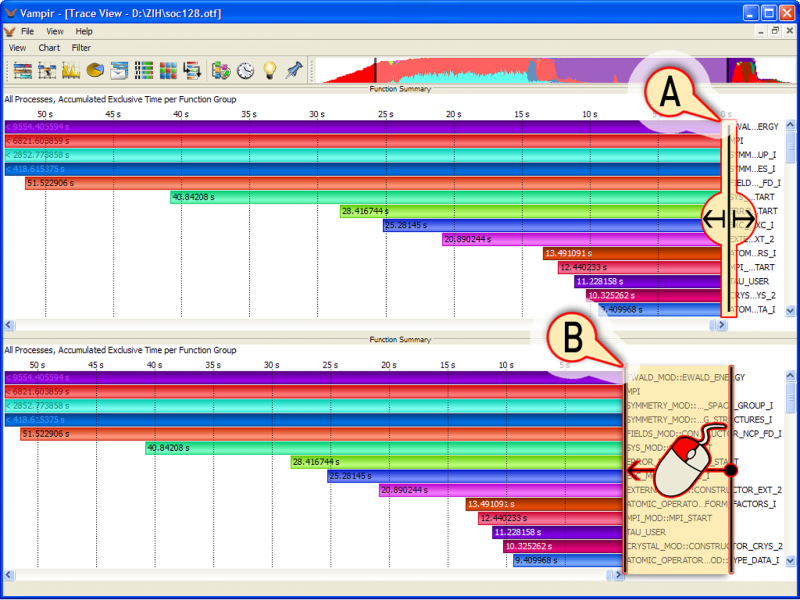
Considering that labels (e.g., those showing names or values of functions) often need more space to show their whole text, there is a further form of resizing/arranging. In order to read labels completely, it is possible to resize the distribution of space owned by the labels and the graphical representation in a chart. When one hovers over the blank space between labels and graphical representation, a moveable separator appears. After clicking a separator decoration, moving the mouse while holding the left mouse button causes resizing.

_images/Resize_labels.png

Resizing Labels: (A) Hover over a Separator Decoration; (B) Drag and Drop the Separator

All of the chart displays have their own context menus with common entries as well as display-specific ones. In the following section, only the most common entries will be discussed. A context menu can be accessed by right clicking in the display window. Common entries are:

  • Reset Zoom: Go back to the initial state in horizontal zooming.
  • Reset Vertical Zoom: Go back to the initial state in vertical zooming.
  • Set Metric: Change values which should be represented in the chart, e.g.?*Exclusive Time*?to?*Inclusive Time*.
  • Sort By:Rearrange values or bars by a certain characteristic.

Zooming is a key feature of Vampir. In most charts it is possible to zoom in and out to get abstract and detailed views of the visualized data. In the timeline charts, zooming produces a more detailed view of a special time interval and therefore reveals new information that could not be seen in the larger section. Short function calls in the?Master Timeline?may not be visible unless an appropriate zooming level has been reached. If the execution time of these short functions is too short regarding the pixel resolution of your computer display, the selection of a shorter time interval is required. Note: Other charts can be affected when zooming in timeline displays: The interval chosen in a timeline chart such as Master Timeline?or?*Process Timeline*?also defines the time interval for the calculation of accumulated measurements in the statistical charts. Statistical charts like the?Function Summary?provide zooming of statistic values. In these cases zooming does not affect any other chart. Zooming is disabled in the?Pie Chart?mode of the?Function Summary?reachable via context menu under?Set Chart Mode->Pie Chart.

_images/Zooming.png

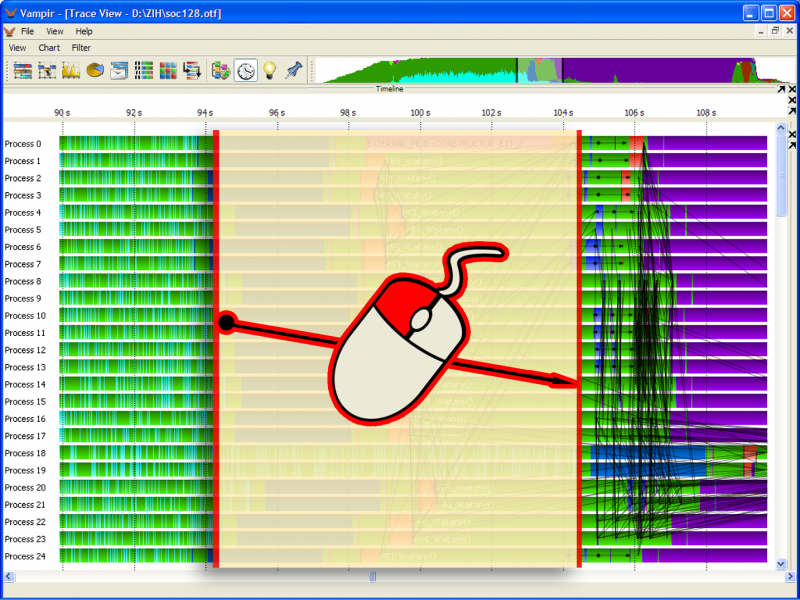
To zoom into an area, click and hold the left mouse button and select the area. It is possible to zoom horizontally and in some charts also vertically. Horizontal zooming in the Master Timeline?defines the time interval to be visualized whereas vertical zooming selects a group of processes to be displayed. To scroll horizontally move the slider at the bottom or use the mouse wheel. Additionally, the zoom can be accessed with help of the Zoom Toolbar?by dragging the borders of the selection rectangle or scrolling down the mouse wheel. To return to the previous zooming state, the global “Undo” is provided that in the “Edit” menu; alternatively, press “Ctrl+Z” to revert to the last zoom. Accordingly, a zooming action can be repeated by selecting “Redo” in the “Edit” menu or pressing “Ctrl+Shift+Z”. Both functions work independently of the current mouse position. Next to “Undo” and “Redo” it is shown which kind of action in which display could be undone and redone, respectively. To get back to the initial state of zooming in a fast way select?Reset Horizontal Zoom?or?*Reset Vertical Zoom*?in the context menu of the desired timeline display. To reset zoom is also an action that can be reverted by “Undo”.

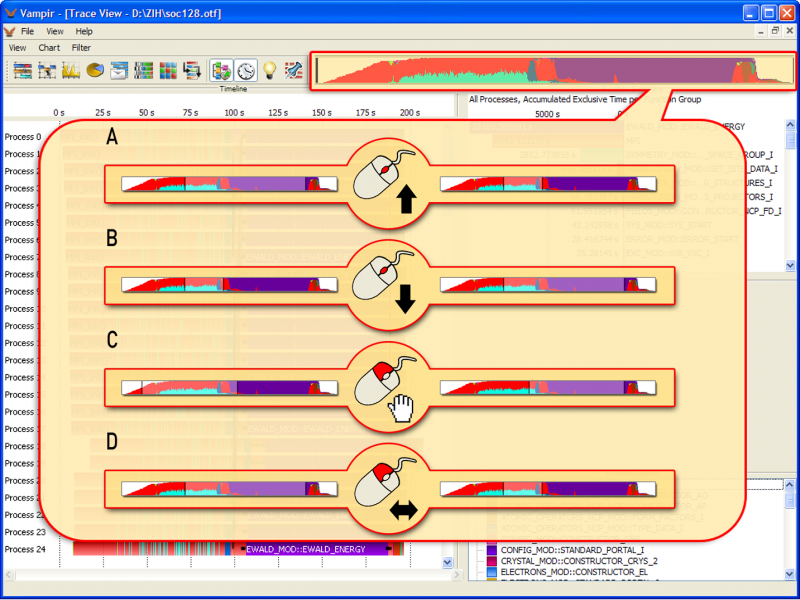
Vampir provides a?Zoom Toolbar that can be used for zooming and navigation in the trace data. It is situated in the upper right corner of the Trace View?window. Of course it is possible to drag and drop it as desired. The Zoom Toolbar?offers an overview of the data displayed in the corresponding charts. The current zoomed area can be seen highlighted as a rectangle within the Zoom Toolbar. Clicking on one of the two boundaries and moving it (with left mouse button held) to the intended position executes horizontal zooming in all charts. Note: Instead of dragging boundaries, it is also possible to use the mouse wheel for zooming. Hover over the Zoom Toolbar?and scroll up to zoom in and scroll down to zoom out. Dragging the zoom area changes the section that is displayed without changing the zoom factor. For dragging, click in the highlighted zoom area and drag and drop it to the desired region. If the user double clicks in the?Zoom Toolbar, the initial zooming state is reverted to.

_images/Zoom_toolbar.png

Zooming and Navigation within the Zoom Toolbar: (A+B) Zooming in/out with Mouse Wheel; (C) Scrolling by Moving the Highlighted Zoom Area; (D) Zooming by Selecting and Moving a Boundary of the Highlighted Zoom Area

The colors represent user-defined groups of functions or activities. Please note that all charts added to the?Trace View?window will adapt their statistics information according to this time interval selection. The?Zoom Toolbar can be disabled and enabled with the toolbar’s context menu entry?Zoom Toolbar.

Use the?Charts?toolbar to open instances of the different charts. It is situated in the upper left corner of the main window by default. Of course, it is also possible to drag and drop it as desired. The?Charts?toolbar can be disabled with the toolbar’s context menu entry?Charts. The table below shows the different icons representing the charts in?Charts?toolbar. The icons are arranged in three groups, divided by a small separator. The first group represents timeline charts, whose zooming states affect all other charts. The second group consists of statistical charts, providing special information and statistics for a chosen interval. Vampir allows multiple instances for charts of these categories. The last group comprises informational charts, providing specific textual information or legends. Only one instance of an informational chart can be opened at a time.

Icon Name Description
_images/icon_master_tl.png Master Timeline `Master
Timeline <https://wiki.futuregrid.org/index.php/Docs/Performance/Vampir#Master_Timeline_and_Process_Timeline>`__
    • images/icon_process_tl.png-ProcessTimeline
    • `Process

Timeline <https://wiki.futuregrid.org/index.php/Docs/Performance/Vampir#Master_Timeline_and_Process_Timeline>`__
    • _images/icon_counter_tl.png
    • Counter Data Timeline

    • `Counter

Data <https://wiki.futuregrid.org/index.php/Docs/Performance/Vampir#Counter_Data_Timeline>`__
    • _images/icon_radar.png
    • Performance Radar

    • `Performance

Radar <https://wiki.futuregrid.org/index.php/Docs/Performance/Vampir#Performance_Radar>`__
    • _images/icon_function_summ.png
    • Function Summary

    • `Function

Summary <https://wiki.futuregrid.org/index.php/Docs/Performance/Vampir#Function_Summary>`__
    • _images/icon_message_summ.png
    • Message Summary

    • `Message

Summary <https://wiki.futuregrid.org/index.php/Docs/Performance/Vampir#Message_Summary>`__
    • _images/icon_process_summ.png
    • Process Summary

    • `Process

Summary <https://wiki.futuregrid.org/index.php/Docs/Performance/Vampir#Process_Summary>`__
    • _images/icon_matrix.png
    • Communication Matrix View

    • `Communication Matrix

View <https://wiki.futuregrid.org/index.php/Docs/Performance/Vampir#Communication_Matrix_View>`__
    • _images/icon_calltree.png
    • Call Tree

    • `Call

Tree <https://wiki.futuregrid.org/index.php/Docs/Performance/Vampir#Call_Tree>`__
    • _images/icon_legend.png
    • Function Legend

    • `Function

Legend <https://wiki.futuregrid.org/index.php/Docs/Performance/Vampir#Function_Legend>`__
    • _images/icon_context.png
    • Context View

    • `Context

View <https://wiki.futuregrid.org/index.php/Docs/Performance/Vampir#Context_View>`__
    • _images/icon_marker.png
    • Marker View

    • `Marker

View <https://wiki.futuregrid.org/index.php/Docs/Performance/Vampir#Information_Filtering_and_Reduction>`__

Vampir provides a display containing the most important characterizations of the used tracefile. This tabular is called?Trace Properties?and can be accessed by?File->Trace Properties. The information, such as the filename, the creator and its version, originates from the tracefile and is not changed by Vampir.

Performance Data Visualization

This chapter deals with the different charts that can be used to analyze the behavior of a program and the comparison between different function groups, e.g., MPI and Calculation. In addition, the chapter addresses communication performance issues. Various charts address the visualization of data transfers between processes. The following sections describe them in detail.

A very common chart type used in event-based performance analysis is the so-called timeline chart. This chart type graphically presents the chain of events of monitored processes or counters on a horizontal time axis. Multiple timeline chart instances can be added to the?Trace View?window via the?Chart?menu or the?Charts?toolbar.

Note: To measure the duration between two events in a timeline chart, Vampir provides a tool called ruler. Click on the first event in a timeline display and move the mouse while keeping the left mouse key and Shift?pressed. A ruler-like pattern appears in the current timeline chart, which provides rough measurement directly. The exact time of the start event and the mouse position and the interval in between is given at the very bottom. If the?Shift?key is released before the left mouse key, Vampir will proceed with zooming.

Master Timeline and Process Timeline

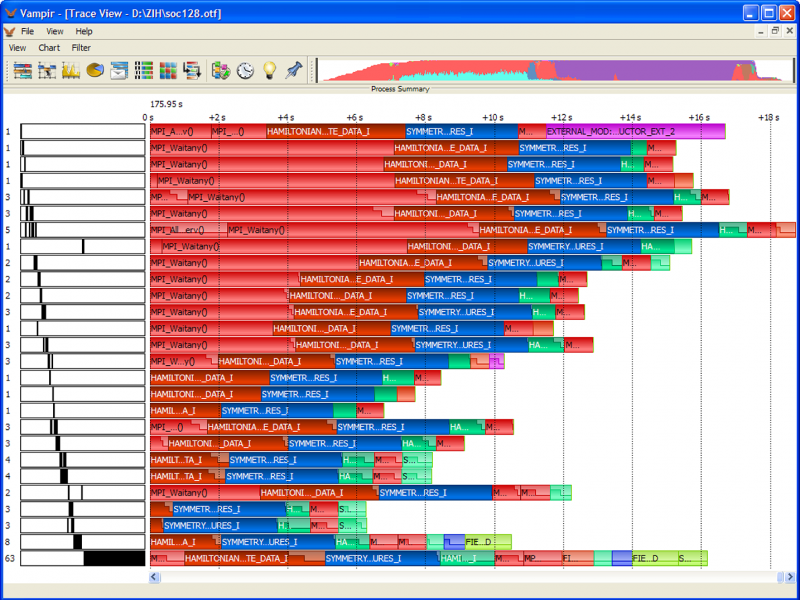
In the Master and Process Timelines, detailed information about functions, communication, and synchronization events is shown. Timeline charts are available for individual processes (Process Timeline) as well as for a collection of processes (Master Timeline). The?Master Timeline?consists of a collection of rows. Each row represents a single process, as shown in the figure below. A?Process Timeline?shows the different levels of function calls in a stacked bar chart for a single process, as depicted in the second figure.

_images/Master_timeline.png

Master Timeline

_images/Process_timeline.png

Process Timeline

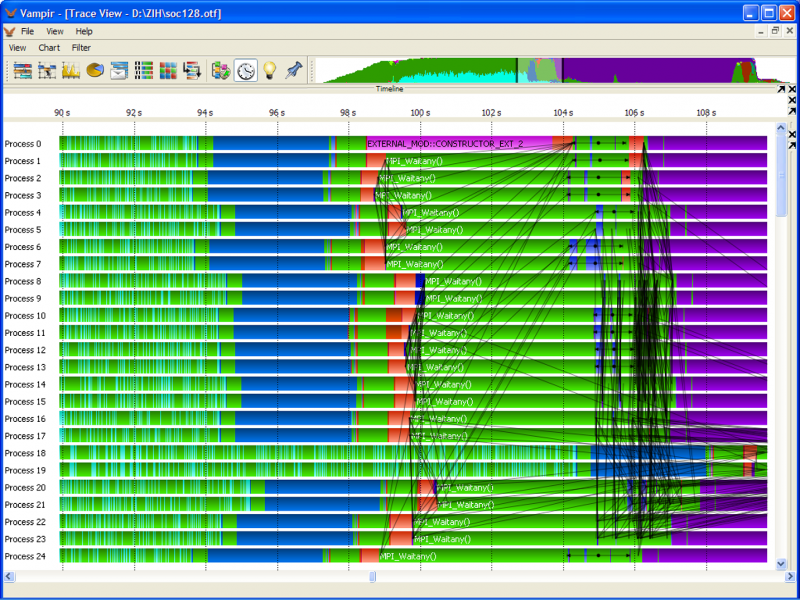
Every timeline row consists of a process name on the left and a colored sequence of function calls or program phases on the right. The color of a function is defined by its group membership; e.g., MPI_Send() belonging to the function group MPI has the same color, presumably red, as MPI_Recv(), which also belongs to the function group MPI. Clicking on a function highlights it and causes the?Context View?display to show detailed information about that particular function, e.g., its corresponding function group name, time interval, and the complete name. The?Context View?display is explained in its own section below. Some function invocations are very short, and will not show up in the overall view because of a lack of display pixels. A zooming mechanism is provided to inspect a specific time interval in more detail. If zooming is performed, panning in a horizontal direction is possible with the scroll bar at the bottom. The?Process Timeline?resembles the Master Timelinewith slight differences. The chart’s timeline is divided into levels, which represent the different call stack levels of function calls. The initial function begins at the first level, a sub-function called by that function is located a level beneath, and so forth. If a sub-function returns to its caller, the graphical representation also returns to the level above. In addition to the display of categorized function invocations, Vampir’s Master?and?*Process Timeline*?also provide information about communication events. Messages exchanged between two different processes are depicted as black lines. In timeline charts, the progress in time is reproduced from left to right. The leftmost starting point of a message line and its underlying process bar therefore identify the sender of the message, whereas the rightmost position of the same line represents the receiver of the message. The corresponding function calls normally reflect a pair of MPI communication directives like MPI_Send() and MPI_Recv(). It is also possible to show a collective communication like MPI_Allreduce() by selecting one corresponding message as shown in the figure.

_images/collectives.png

Selected MPI Collective in Master Timeline

Additional information like message bursts, markers, and I/O events is also available. The table shows the symbols and descriptions of these objects.

Additional Information in Master and Process Timeline

Symbol Description
Message Burst .. image:: images/burst.png Because of a lack of pixels it is not possible to display a large number of messages in a very short interval. Therefore, these messages are summarized as so-called message bursts. Zooming into this interval reveals the corresponding single messages.
Markers .. image:: images/marker-multiple.png multiple .. image:: images/marker-template.png single To indicate particular points (like errors or warnings) during the

runtime of an application, markers can be used in a tracefile. They are drawn as triangles, which are colored according to their types. To illustrate that two or more markers are placed at the same pixel, a multiple marker is drawn.

    • I/O Events .. image:: images/io-multiple.png multiple .. image:: images/io-single.png single .. image:: images/io-single-selected.png single, selected
    • Vampir shows detailed information about I/O operations, if they are

included in the tracefile. I/O events are depicted as triangles at the beginning of an I/O interval. Multiple I/O events are tricolored and occupy a line to the end of the interval. To see the whole interval of a single I/O event, the triangle has to be selected. In that case, a second triangle at the end of the interval appears.

Since the?Process Timeline?reveals information of one process only, short black arrows are used to indicate outgoing communication. Clicking on message lines or arrows shows message details like sender process, receiver process, message length, message duration, and message tag in the?Context View?display.

Counter Data Timeline

Counters are values collected over time to count certain events like floating point operations or cache misses. Counter values can be used to store not just hardware performance counters but arbitrary sample values. There can be counters for different statistical information as well, for instance, counting the number of function calls or a value in an iterative approximation of the final result. Counters are defined during the instrumentation of the application and can be individually assigned to processes.

_images/Counter_data_timeline.png

Counter Data Timeline

The chart is restricted to one counter at a time. It shows the selected counter for one process. Using multiple instances of the?Counter Data Timeline, counters or processes can be compared easily. The context menu entry?Set Counter?allows you to choose the displayed counter directly from a drop-down list. The entry?Set Process?selects the particular process for which the counter is shown.

Performance Radar

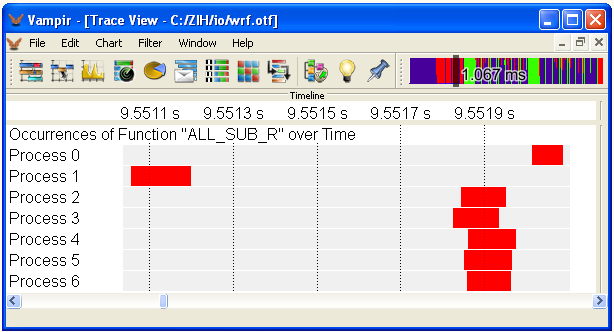
The Performance Radar chart provides the search of function occurrences in the trace file and the extended visualization of counters. It can happen that a function is not shown in?Master?and?*Process Timeline*?due to a short runtime. An alternative to zooming is the option?Find Function.... A color-coded timeline indicates the intervals in which the function is executed.

_images/performance_radar_find_function.png

Performance Radar Timeline - Search of Functions

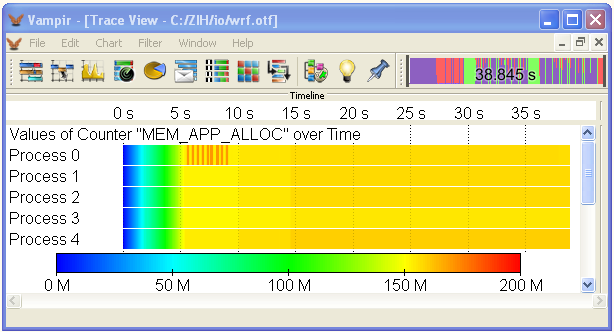
By default, the Performance Radar shows the values of one counter for each process (thread). In this mode the user can choose between Line Plot?and?*Color Coded*?drawing. In the latter case, a color scale on the bottom provides information about the range of values. Clicking on Set Counter...?leads to a dialog that offers the option of choosing another counter and calculating the sum or average values. Summarizing means that the values of the selected counter of all processes are summed up. The average is this sum divided by the number of processes. Both options provide a single graph.

_images/performance_radar_set_counter.png

Performance Radar Timeline - Visualization of Counters

Call Tree

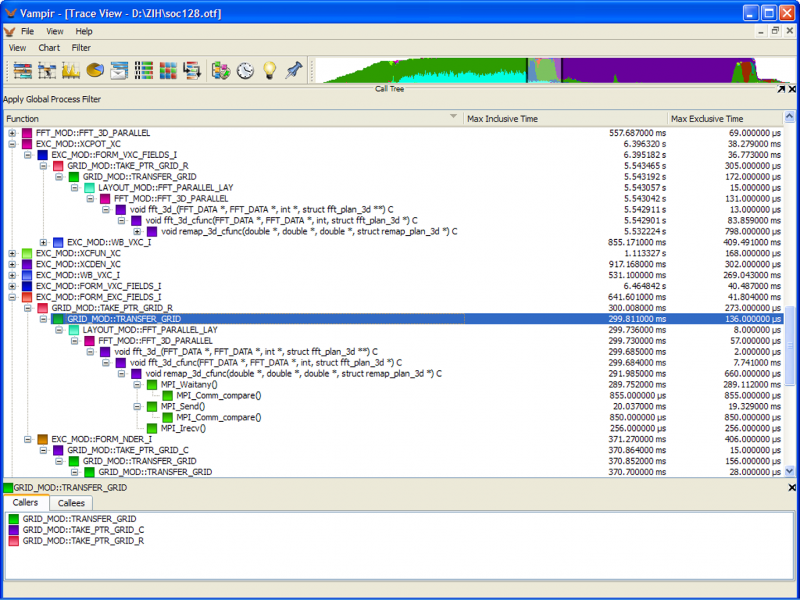
The Call Tree illustrates the invocation hierarchy of all monitored functions in a tree representation. The display reveals information about the number of invocations of a given function, the time spent in the different calls, and the caller-callee relationship.

_images/Call_tree.png

Call Tree

The entries of the?Call Tree?can be sorted in various ways. Simply click on one header of the tree representation to use its characteristic to resort the?Call Tree. Please note that not all available characteristics are enabled by default. To add or remove characteristics, a context menu is accessible by right-clicking on any of the tree headers. To leaf through the different function calls, it is possible to fold and unfold the levels of the tree. This can be achieved by double-clicking a level, or by using the fold level buttons next to the function name. Functions can be called by many different caller functions, which is hardly obvious in the tree representation. Therefore, a relation view shows all callers and callees of the currently selected function in two separated lists, as shown in the lower area. To find a certain function by its name, Vampir provides a search option accessible with the context menu entry?Show Find View. The entered keyword has to be confirmed by pressing the Return key. The?Previous?and?*Next*?buttons can be used to flip through the results afterwards.

Function Summary

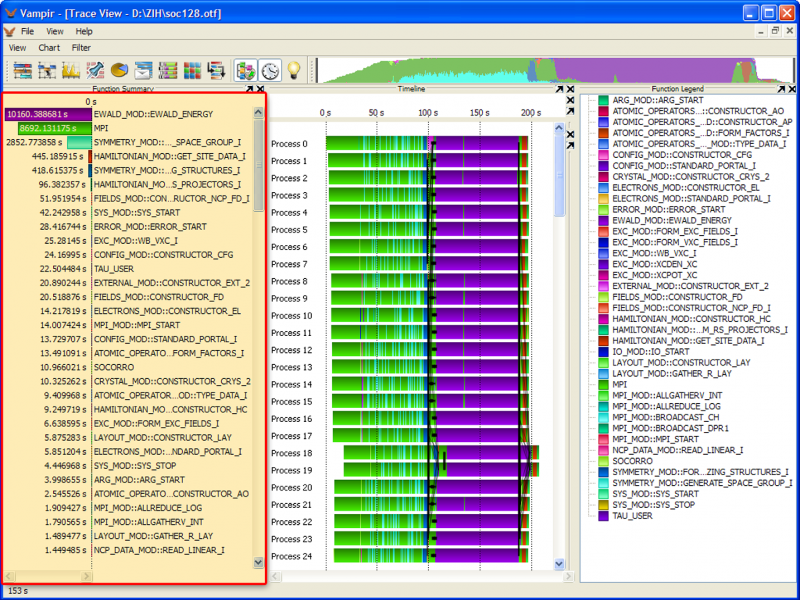
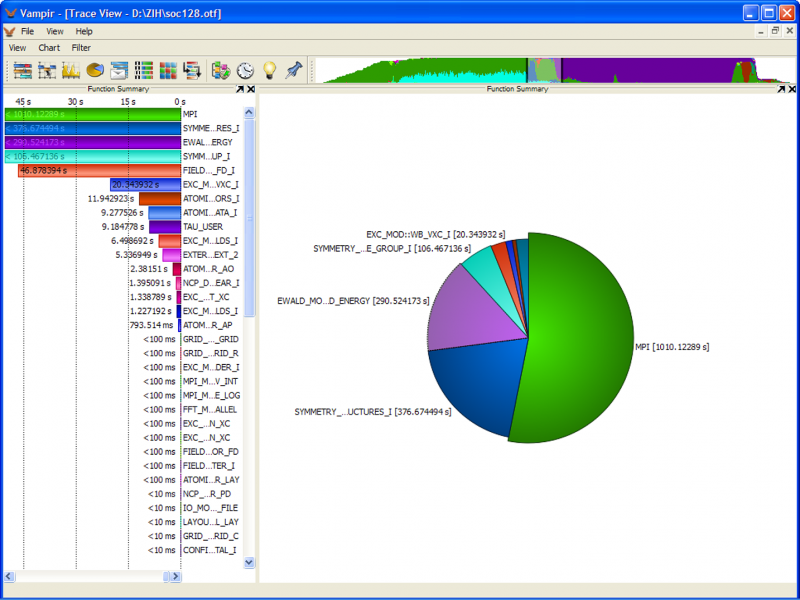
The?Function Summary?chart gives an overview of the accumulated time consumption across all function groups and functions. For example every time a process calls the MPI_Send() function, the elapsed time of that function is added to the MPI function group time. The chart gives a condensed view on the execution of the application and a comparison between the different function groups can be made so that dominant function groups can be distinguished easily.

_images/Function_summary.png

Function Summary

It is possible to change the information displayed via the context menu entry?Set Metric, which offers values like?Average Exclusive Time, Number of Invocations,?Accumulated Inclusive Time?and others. Note:?Inclusive?means the amount of time spent in a function and all of its subroutines.?*Exclusive*?means the amount of time just spent in this function. The context menu entry?Set Event Category?specifies whether either function groups or functions should be displayed in the chart. The functions own the color of their function group. It is possible to hide functions and function groups from the displayed information with the context menu entry?Filter. To mark the function or function group to be filtered, click the associated label or color representation in the chart. Using the?Process Filter?allows you to restrict this view to a set of processes. As a result, only the consumed time of these processes is displayed for each function group or function. Instead of using the filter (which affects all other displays by hiding processes), it is possible to select a single process via?Set Process?in the context menu of the Function Summary. This does not have any effect on other timeline displays. The?Function Summary?can be shown as a?Histogram?(a bar chart, as in timeline charts) or as a?Pie Chart. To switch between these representations, use the?Set Chart Mode?entry of the context menu. The shown functions or function groups can be sorted by name or value via the context menu option?Sort By.

Process Summary

The?Process Summary?is similar to the?Function Summary?but shows the information for every process independently.

_images/Process_summary.png

Process Summary

This is useful for analyzing the balance between processes to reveal bottlenecks. For instance, finding that one process spends a significantly high time performing the calculations could indicate an unbalanced distribution of work that can slow down the entire application. The context menu entry?Set Event Category?specifies whether either function groups or functions should be displayed in the chart. The functions own the color of their function group. The chart can calculate the analysis based on Exclusive Time?or?*Inclusive Time*. To change between these two modes, use the context menu entry?Set Metric. It is possible to hide functions and function groups from the displayed information with the context menu entry?Filter. To mark the function or function group to be filtered, click on the associated color representation in the chart. Using the?Process Filter?allows you to restrict this view to a set of processes.

Message Summary

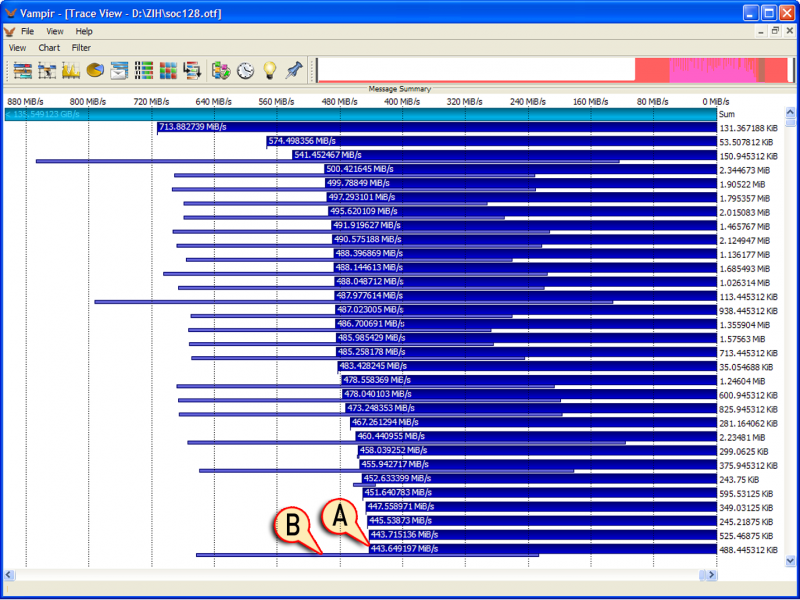
The?Message Summary?is a statistical chart showing an overview of the different messages grouped by certain characteristics.

_images/Messagesummary.png

Message Summary Chart with metric set to?*Message Transfer Rate*?showing the average transfer rate?(A), and the minimal/maximal transfer rate?(B)

All values are represented in a bar chart fashion. The number next to each bar is the group base, while the number inside a bar depicts the different values depending on the chosen metric. Therefore, the?Set Metric?sub-menu of the context menu can be used to switch between Aggregated Message Volume,?Message Size,?Number of Messages, and Message Transfer Rate. The group base can be changed via the context menu entry?Group By. It is possible to choose between Message Size,?Message Tag, and?Communicator (MPI).

Note: There will be one bar for every occurring group. However, if metric is set to?Message Transfer Rate, the minimal and the maximal transfer rate is given in an additional bar beneath the one showing the average transfer rate. The additional bar starts at the minimal rate and ends at the maximal one. To filter out messages, click on the associated label or color representation in the chart and choose Filter?from the context menu afterwards.

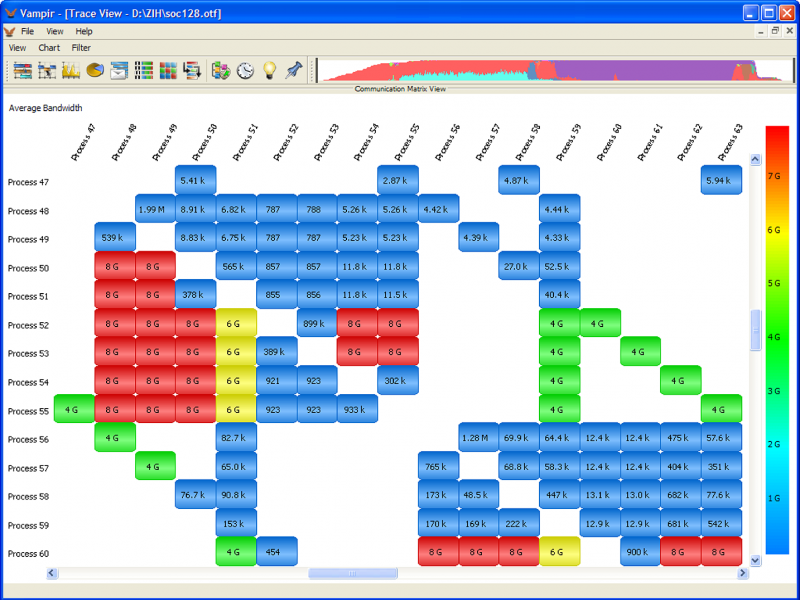
Communication Matrix View

The Communication Matrix View?is another way of analyzing communication imbalances. It shows information about messages sent between processes.

_images/Communication_matrix_view.png

Communication Matrix View

The chart is realized as a table. Its rows represent the sending processes while its columns represent the receivers. The color legend on the right indicates the displayed values. Depending on the displayed information, the color legend changes. It is possible to change the type of displayed values. Different metrics like the average duration of messages passed from sender to recipient or minimum and maximum bandwidth are offered. To change the type of value that is displayed, use the context menu option?Set Metric. Use the?Process Filter?to define which processes/groups should be displayed.

Note: A high duration is not automatically caused by a slow communication path between two processes, but can also be due to the fact that the time between starting transmission and successful reception of the message can be increased by a recipient that delays reception for some reason. This will cause the duration to increase (by this delay) and the message rate, which is the size of the message divided by the duration, to decrease accordingly.

Function Legend

The?Function Legend?lists all visible function groups of the loaded trace file along with its corresponding color.

_images/Function_legend.png

Function Legend

If colors of functions are changed, they appear in a tree-like fashion under their respective function group as well.

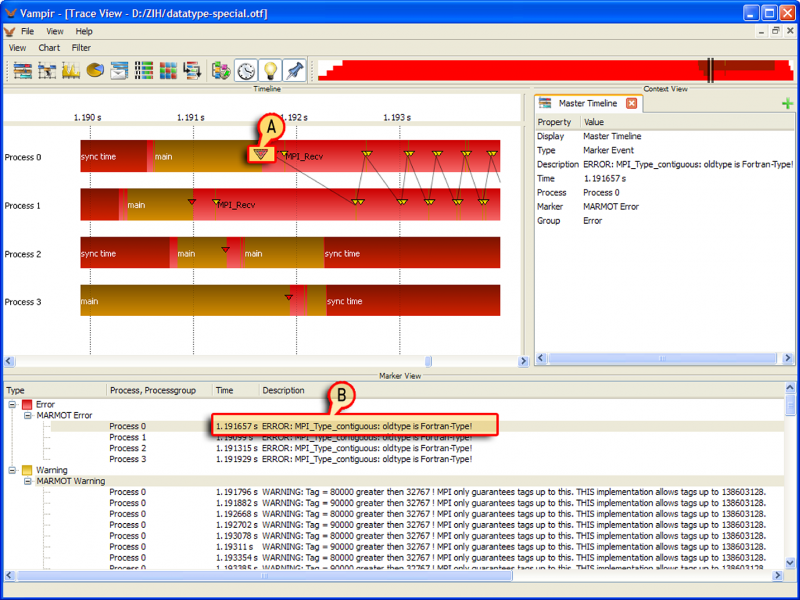
_images/Marker_view.png

A chosen marker (A) and its representation in the Marker View (B)

The display is given in a tree-like fashion and organizes the marker events in their respective groups and types. Additional information, like the time of occurrence in the trace file and its description, is provided for each marker. By clicking on a marker event in the?Marker View, this event gets selected in the timeline displays that are currently open, and vice-versa. If this marker event is not visible, the zooming area jumps to this event automatically. It is possible to select markers and types. Then all events belonging to that marker or type get selected in the?Master Timeline?and the?Process Timeline. If?Ctrl?or?*Shift*?is pressed, the user can highlight several events. In this case, the user can fit the borders of the zooming area in the timeline charts to the timestamps of the two marker events that were chosen at last.

Context View

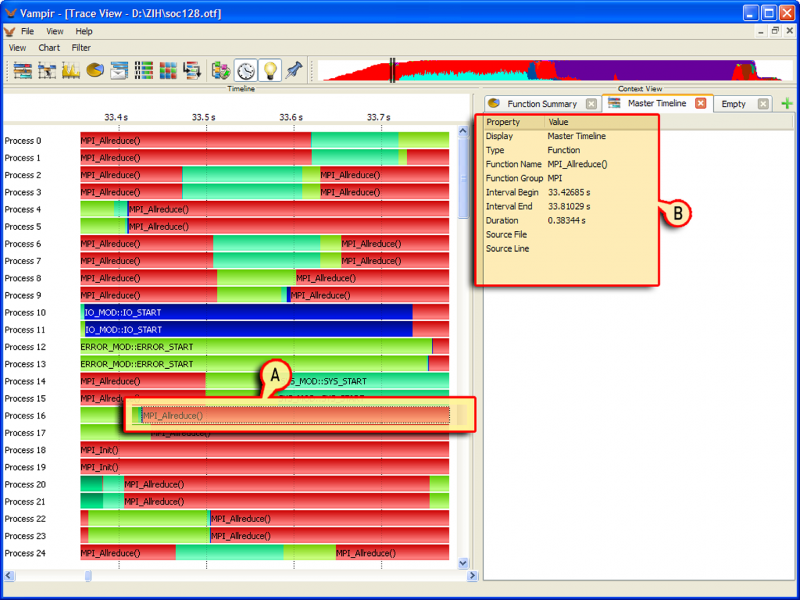
_images/Context_view.png

Context View, showing context information (B) of a selected function (A)

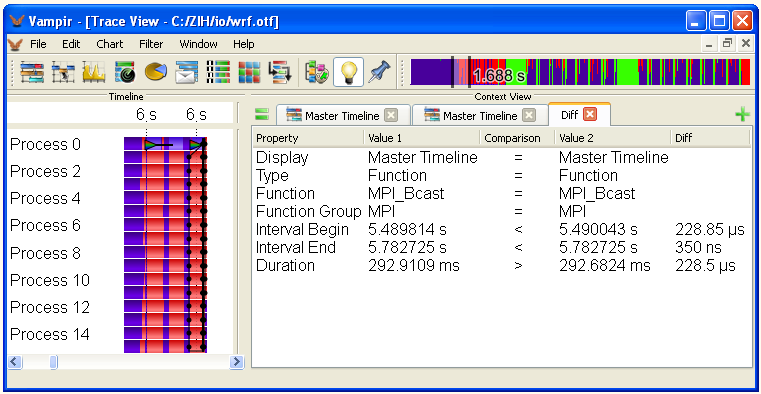
As implied by its name, the Context View?provides more detailed information of a selected object compared to its graphical representation. An object, e.g., a function, function group, message, or message burst, can be selected directly in a chart by clicking its graphical representation. For different types of objects, different context information is provided by the?Context View. For example, the object-specific information for functions holds properties like?Interval Begin,?Interval End, and?Duration. The?Context View?may contain several tabs, and a new empty one can be added by clicking on the?add-symbol on the right hand side. If an object in another chart is selected, its information is displayed in the current tab. If the?Context View?is closed, it opens automatically in that moment. The?Context View?offers a comparison between the information that is displayed in different tabs. Just use the?=?on the left hand side and choose two objects in the emerged dialog. It is possible to compare different elements from different charts, which can be useful in some cases. The comparison shows a list of common properties. The corresponding values are displayed, along with their difference if the values are numbers. The first line always shows the names of the displays.

_images/context_compare.png

Comparison between Context Information

Information Filtering and Reduction

Due to the large amount of information that can be stored in trace files, it is usually necessary to reduce the displayed information according to some filter criteria. In Vampir, there are different ways of filtering. It is possible to limit the displayed information to a certain choice of processes or to specific types of communication events, e.g., to certain types of messages or collective operations. Deselecting an item in a filter means that this item is fully masked. In Vampir, filters are global. Therefore, masked items will no longer show up in any chart. Filtering not only affects the different charts, but also the Zoom Toolbar. The different filters can be reached via the Filter entry in the main menu.

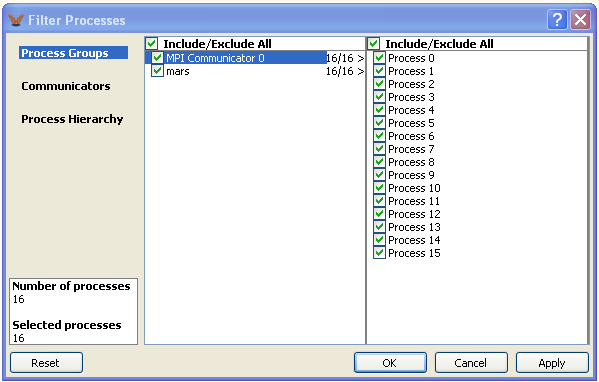
The example below shows a typical process representation in the Process Filter?window. This kind of representation is equal to all other filters. Processes can be filtered by their?Process Group,?Communicators?and?*Process Hierarchy*. Items to be filtered are arranged in a spreadsheet representation. In addition to selecting or deselecting an entire group of processes, it is certainly possible to filter single processes.

_images/process_filter.png

Process Filter

Different selection methods can be used in a filter. The check box Include/Exclude All?either selects or deselects every item. Specific items can be selected/deselected by clicking the check box next to it. Furthermore, it is possible to select/deselect multiple items at once; mark the desired entries by clicking their names while holding either the?Shift?or the Ctrl?key. By holding the?Shift?key every item in between the two clicked items will be marked. Holding the Ctrl?key, on the other hand, enables you to add or remove specific items from/to the marked ones. Clicking the check box of one of the marked entries will cause selection/deselection for all of them.

Options of Filtering

Filter Object Filter Criteria
Processes Process Groups
  Communicators
  Process Hierarchy
  Single Processes
Collective Operations Communicators
  Collective Operations
Messages Message Communicators
  Message Tags
I/O Events I/O Groups
  Files
  Types

Customization

The appearance of the trace file and various other application settings can be altered in the preferences accessible via the main menu entry File->Preferences. Settings concerning the trace file itself, e.g., layout or function group colors, are saved individually next to the tracefile in a file, whose end is?.vsettings. In this way, it is possible to adjust the colors for one trace file without interfering with other trace files. The options Import Preferences?and?*Export Preferences*?provide the loading and saving of preferences of arbitrary tracefiles.

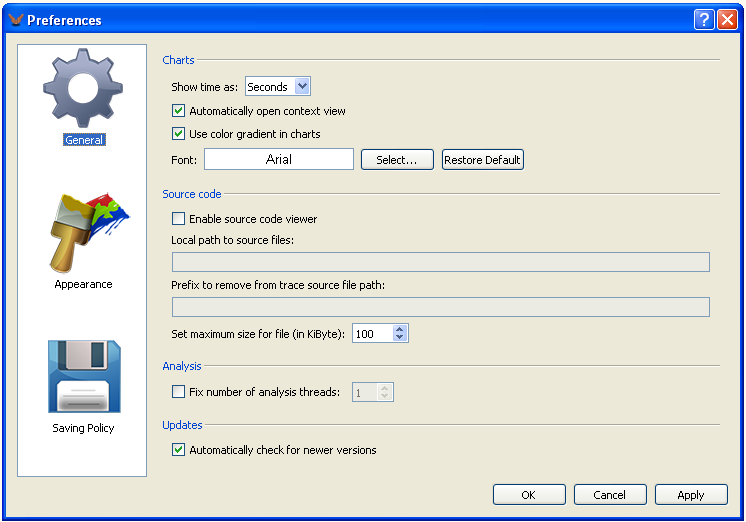
The General settings allow you to change application and trace specific values.

_images/pref_general.png

General Settings

Show time asdecides whether the time format for the trace analysis is based on seconds or ticks. The next point?Use color gradient in chartsallows you to switch off the color gradient used in the performance charts. The next option is to change the style and size of the font.?*Show source code* allows you to open an editor showing the respective source file. In order to open a source file, first click on the intended function in the Master Timeline?and then on the source code path in the?Context View. For the source code location to work properly, you need a trace file with source code location support. The path of the source file can be adjusted in?Preferences. A limit for the size of the file can be set, too. Finally, the user can decide if he wants Vampir to automatically check for new versions.

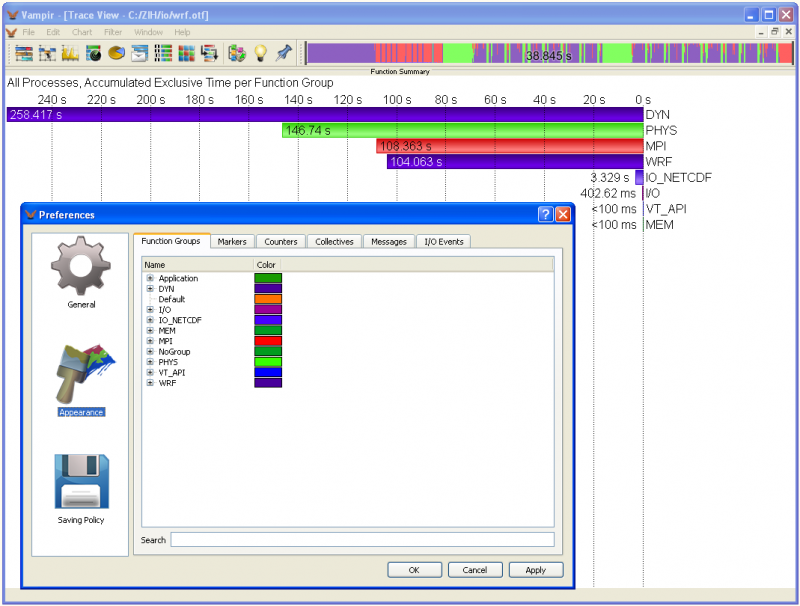
In the Appearance settings of the Preferences dialog, there are six different objects for which the color options can be changed: the functions/function groups, markers, counters, collectives, messages and I/O events. Choose an entry and click on its color to make a modification. A color picker dialog opens where it is possible to adjust the color. For messages and collectives, a change of the line width is also available.

Appearance Settings

In order to quickly find the desired item a search box is provided at the bottom of the dialog.

Vampir detects whenever changes to the various settings are made. In the?Saving Policy?dialog it is possible to adjust the saving behavior of the different components to your own needs.

Saving Policy Settings

In the dialog?Saving Behavior?you tell Vampir what to do in the

case of changed preferences. The user can choose the categories of settings (e.g., layout) that should be treated. Possible options are that the application automatically?Always?or?*Never*?saves changes. The default option is to have Vampir asking you whether to save or discard changes. Usually the settings are stored in the folder of the tracefile. If the user has no access to it, it is possible to place them in the?Application Data Folder. They are listed in the tab?Locally Stored Preferences?with creation and modification date. | Note: On loading, Vampir favors settings in the?Application Data Folder.?*Default Preferences*?offers to save preferences of the current trace file as default settings, where they are then used for tracefiles without settings. Another option is to restore the default settings; in this case, the current preferences of the tracefile are reverted.

Footnotes

Additional links that might be of interest to the reader:

... (OTF)?`http://www.tu-dresden.de/zih/otf <http://www.tu-dresden.de/zih/otf>`__

... WindowsHPC?http://resourcekit.windowshpc.net/MORE_INFO/TracingMPIApplications.html

... Manual?http://www.tu-dresden.de/zih/vampirtrace

Retrieved from “https://wiki.futuregrid.org/index.php/Docs/Performance/Vampir

VampirTrace

VampirTrace consists of a tool set and a runtime library for instrumentation and tracing of software applications. It is particularly tailored to parallel and distributed High Performance Computing (HPC) applications.

VampirTrace is currently available on FutureGrid machines under module ‘vampirtrace’. VampirTrace is also available in OpenMPI versions 1.5.x or higher. For example on Bravo, it is available as openmpi/1.5.4-gnu or openmpi/1.5.4-intel.

The instrumentation part of VampirTrace modifies a given application in order to inject additional measurement calls during runtime. The tracing part provides the actual measurement functionality used by the instrumentation calls. By this means, a variety of detailed performance properties can be collected and recorded during runtime. This includes function enter and leave events, MPI communication, OpenMP events, and performance counters.

After a successful tracing run, VampirTrace writes all collected data to a trace file in the Open Trace Format (OTF). As a result, the information is available for post-mortem analysis and visualization by various tools. Most notably, VampirTrace provides the input data for the Vampir analysis and visualization tool.

Trace files can quickly become very large, especially with automatic instrumentation. Tracing applications for only a few seconds can result in trace files of several hundred megabytes. To protect users from creating trace files of several gigabytes, the default behavior of VampirTrace limits the internal buffer to 32MB per process (2GB on FutureGrid systems). Thus, even for larger scale runs the total trace file size will be moderate.

The following list shows a summary of all instrumentation and tracing features that VampirTrace offers. Note that not all features are supported on all platforms.

Tracing of User Functions

  • Record function enter and leave events
  • Record name and source code location (file name, line)
  • Manual instrumentation using VampirTrace API

MPI Tracing

  • Record MPI functions
  • Record MPI communication: participating processes, transferred bytes, tag, communicator

OpenMP Tracing

  • OpenMP directives, synchronization, thread idle time
  • Also hybrid (MPI and OpenMP) applications are supported

Pthread Tracing

  • Trace POSIX thread API calls
  • Also hybrid (MPI and POSIX threads) applications are supported

Java Tracing

  • Record method calls
  • Using JVMTI as interface between VampirTrace and Java Applications

3rd-Party Library tracing

  • Trace calls to arbitrary third party libraries
  • Generate wrapper for library functions based on library’s header file(s)
  • No recompilation of application or library is required

MPI Correctness Checking

  • Record MPI usage errors
  • Using UniMCI as interface between VampirTrace and a MPI correctness checking tool (e.g., Marmot)

User API

  • Manual instrumentation of source code regions
  • Measurement controls
  • User-defined counters
  • User-defined marker

Performance Counters

  • Hardware performance counters using PAPI, CPC, or NEC SX performance counter
  • Resource usage counters using getrusage

Memory Tracing

  • Trace GLIBC memory allocation and free functions
  • Record size of currently allocated memory as counter

I/O Tracing

  • Trace LIBC I/O calls
  • Record I/O events: file name, transferred bytes

CPU ID Tracing

  • Trace core ID of a CPU on which the calling thread is running
  • Record core ID as counter

Fork/System/Exec Tracing

  • Trace applications calling LIBC’s fork, system, or one of the exec functions
  • Add forked processes to the trace

Filtering & Grouping

  • Runtime and post-mortem filter (i.e., exclude functions from being recorded in the trace)
  • Runtime grouping (i.e., assign functions to groups for improved analysis)

OTF Output

  • Writes compressed OTF files
  • Output as trace file, statistical summary (profile), or both

Instrumentation

To perform measurements with VampirTrace, the user’s application program needs to be instrumented; that is, at specific points of interest (called “events”), VampirTrace measurement calls have to be activated. Common events are, among others, entering and leaving of functions as well as sending and receiving of MPI messages. VampirTrace handles this automatically by default. In order to enable the instrumentation of function calls, the user needs only to replace the compiler and linker commands with VampirTrace’s wrappers (see below). VampirTrace supports different ways of instrumentation as described in the sections below.

Compiler Wrappers

All the necessary instrumentation of user functions, MPI, and OpenMP events is handled by VampirTrace’s compiler wrappers (vtcc, vtcxx, vtf77, and vtf90). In the script used to build the application (e.g., a makefile), all compile and link commands should be replaced by the VampirTrace compiler wrapper. The wrappers perform the necessary instrumentation of the program and link the suitable VampirTrace library. The following list shows some examples specific to the parallelization type of the program:

  • Serial programs

Compiling serial codes is the default behavior of the wrappers. Simply replace the compiler by VampirTrace’s wrapper:

original:              gfortran hello.f90 -o hello

with instrumentation: **vtf90** hello.f90 -o hello

This will instrument user functions (if supported by the compiler) and link the VampirTrace library.

  • MPI parallel programs

MPI instrumentation is always handled by means of the PMPI interface, which is part of the MPI standard. This requires the compiler wrapper to link with an MPI-aware version of the VampirTrace library. If your MPI implementation uses special MPI compilers (e.g. mpicc, mpxlf90), you will need to tell VampirTrace’s wrapper to use this compiler instead of the serial one:

original:             mpicc hello.c -o        hello

with instrumentation: **vtcc -vt:cc mpicc** hello.c -o hello

MPI implementations without their own compilers require the user to link the MPI library manually. In this case, simply replace the compiler by VampirTrace’s compiler wrapper:

original:             icc hello.c -o hello –lmpi

with instrumentation: **vtcc** hello.c -o hello -lmpi

If you want to instrument MPI events only (this creates smaller trace files and less overhead), use the option -vt:inst manual to disable automatic instrumentation of user functions.

  • Threaded parallel programs

When VampirTrace detects OpenMP or Pthread flags on the command line, special instrumentation calls are invoked. For OpenMP events, OPARI is invoked for automatic source code instrumentation.

original:             ifort <-openmp\|-pthread> hello.f90 -o hello

with instrumentation: **vtf90** <-openmp\|-pthread> hello.f90 -o hello

For more information about OPARI, read the documentation available in VampirTrace’s installation directory at: share/vampirtrace/doc/opari/Readme.html

  • Hybrid MPI/Threaded parallel programs

With a combination of the above mentioned approaches, hybrid applications can be instrumented:

original:             mpif90 <-openmp\|-pthread> hello.F90 -o hello

 with instrumentation: **vtf90 -vt:f90 mpif90** <-openmp\|-pthread> hello.F90 -o hello

The VampirTrace compiler wrappers automatically try to detect which parallelization method is used by means of the compiler flags (e.g., -lmpi, -openmp or -pthread) and the compiler command (e.g. mpif90). If the compiler wrapper failed to detect this correctly, the instrumentation could be incomplete and an unsuitable VampirTrace library would be linked to the binary. In this case, you should tell the compiler wrapper which parallelization method your program uses by using the switches -vt:mpi, -vt:mt, and -vt:hyb for MPI, multithreaded, and hybrid programs, respectively. Note that these switches do not change the underlying compiler or compiler flags. Use the option -vt:verbose to see the command line that the compiler wrapper executes.

The default settings of the compiler wrappers can be modified in the files share/vampirtrace/vtcc-wrapper-data.txt (and similar for the other languages) in the installation directory of VampirTrace. The settings include compilers, compiler flags, libraries, and instrumentation types. You could, for instance, modify the default C compiler from gcc to mpicc by changing the line compiler=gcc to compiler=mpicc. This may be convenient if you instrument MPI parallel programs only.

Instrumentation Types

The wrapper option -vt:inst <insttype> specifies the instrumentation type to be used. The following values for <insttype> are possible:

  • compinst

Fully-automatic instrumentation by the compiler

  • manual

Manual instrumentation by using VampirTrace’s API (needs source-code modifications)

Automatic Instrumentation

Automatic instrumentation is the most convenient method to instrument your program. If available, simply use the compiler wrappers without any parameters, e.g.:

vtf90 hello.f90 -o hello

Notes for Using the GNU or Intel Compiler

For these compilers, the command nm is required to get symbol information of the running application executable. To get the application executable for nm during runtime, VampirTrace uses the /proc file system. As /proc is not present on all operating systems, automatic symbol information might not be available. In this case, it is necessary to set the environment variable VT APPPATH to the pathname of the application executable to get symbols resolved via nm.

Should any problems emerge to get symbol information automatically, then the environment variable VT GNU NMFILE can be set to a symbol list file, which is created with the command nm, like:

nm hello > hello.nm

To get the source code line for the application functions use nm -l (on Linux systems). VampirTrace will include this information in the trace. Note that the output format of nm must be written in BSD-style. See the manual page of nm for help in dealing with the output format setting.

Notes on Instrumentation of Inline Functions

Compilers behave differently when they automatically instrument inlined functions. The GNU and Intel (10.0++) compilers instrument all functions by default when they are used with VampirTrace. They therefore switch off inlining completely, disregarding the optimization level chosen. One can prevent these particular functions from being instrumented by appending the following attribute to function declarations, hence making them able to be inlined (this works only for C/C++):

\_\_attribute\_\_ ((\_\_no\_instrument\_function\_\_))

The PGI and IBM compilers prefer inlining over instrumentation when compiling with enabled inlining. Thus, one needs to disable inlining to enable the instrumentation of inline functions and vice versa.

The bottom line is that a function cannot be inlined and instrumented at the same time. Note that you can also use the option -vt:inst manual with non-instrumented sources. Binaries created in this manner only contain MPI and OpenMP instrumentation, which might be desirable in some cases. For more on how to inline functions, read your compiler’s manual.

Using the VampirTrace API

The VT USER START, VT USER END calls can be used to instrument any user-defined sequence of statements.

Fortran

#include "vt\_user.inc"

VT\_USER\_START(’name’)

...

VT\_USER\_END(’name’)

C

#include "vt\_user.h"

VT\_USER\_START("name");

...

VT\_USER\_END("name");

If a block has several exit points (as is often the case for functions), all exit points have to be instrumented with VT USER END, too.

For C++ it is simpler, as is demonstrated in the following example. Only entry points into a scope need to be marked. The exit points are detected automatically when C++ deletes scope-local variables.

C++

#include "vt\_user.h"

{

VT\_TRACER("name");

...
}

The instrumented sources have to be compiled with -DVTRACE for all three languages; otherwise the VT * calls are ignored. Note that Fortran source files instrumented this way have to be preprocessed, too.

In addition, you can combine this particular instrumentation type with all other types. In such a way, all user functions can be instrumented by a compiler while special source code regions (e.g., loops) can be instrumented by VT’s API.

Use VT’s compiler wrapper (described above) for compiling and linking the instrumented source code, such as:

  • combined with automatic compiler instrumentation:
vtcc **-DVTRACE** hello.c -o hello
  • without compiler instrumentation:
vtcc -vt:inst manual **-DVTRACE** hello.c -o hello

Note that you can also use the option -vt:inst manual with non-instrumented sources. Binaries created in this manner only contain MPI and OpenMP instrumentation, which might be desirable in some cases.

Measurement Controls

Switching Tracing On/Off: In addition to instrumenting arbitrary blocks of code, one can use the VT_ON/ VT_OFF instrumentation calls to start and stop the recording of events. These constructs can be used to stop recording of events for a part of the application and later resume recording. For example, one could not collect trace events during the initialization phase of an application and turn on tracing for the computation part.

Furthermore, the “on/off” functionality can be used to control the tracing behavior of VampirTrace, and allows you to trace only parts of interests. Essentially, then, the amount of trace data can be reduced.

To check whether if tracing is enabled or not, use the call VT_IS_ON.

Please note that stopping and starting the recording of events has to be performed at the same call stack level. If this is not the case, an error message will be printed during runtime, and VampirTrace will abort execution.

Intermediate Buffer Flush: In addition to an automated buffer flush when the buffer is filled, it is possible to flush the buffer at any point of the application. This way you can guarantee that after a manual buffer flush there will be a sequence of the program with no automatic buffer flush interrupting. To flush the buffer, you can use the call VT_BUFFER_FLUSH.

Intermediate Time Synchronisation: VampirTrace provides several mechanisms for timer synchronization. In addition, it is also possible to initiate a timer synchronization at any point of the application by calling VT_TIMESYNC. Please note that the user has to ensure that all processes are actual at a synchronized point in the program (e.g., at a barrier). To use this call, make sure that the enhanced timer synchronization is activated (set the environment variable VT_ETIMESYNC).

Intermediate Counter Update: VampirTrace provides the functionality to collect the values of arbitrary hardware counters. Chosen counter values are automatically recorded whenever an event occurs. Sometimes (e.g., within a long-lasting function) it is desirable to get the counter values at an arbitrary point within the program. To record the counter values at any given point, you can call VT_UPDATE_COUNTER.

Note: For all three languages the instrumented sources have to be compiled with -DVTRACE. Otherwise the VT * calls are ignored. In addition, if the sources contain further VampirTrace API calls and only the calls for measurement controls will be disabled, then the sources must also be compiled with -DVTRACE_NO_CONTROL.

Tracing Calls to 3rd-Party Libraries

VampirTrace is also capable of tracing calls to third-party libraries which come with at least one C header file, even without the library’s source code. If VampirTrace was built with support for library tracing, the tool vtlibwrapgen can be used to generate a wrapper library to intercept each call to the actual library functions. This wrapper library can be linked to the application, or used in combination with the LD PRELOAD mechanism provided by Linux. The generation of a wrapper library is done using the vtlibwrapgen command and consists of two steps. The first step generates a C source file, providing the wrapped functions of the library header file:

vtlibwrapgen -g SDL -o SDLwrap.c /usr/include/SDL/\*.h

This generates the source file SDLwrap.c that contains wrapper-functions for all library functions found in the header-files located in /usr/include/SDL/, and instructs VampirTrace to assign these functions to the new group SDL. The generated wrapper source file can be edited in order to add manual instrumentation or alter attributes of the library wrapper. A detailed description can be found in the generated source file or in the header file vt libwrap.h , which can be found in the include directory of VampirTrace. To adapt the library instrumentation it is possible to pass a filter file to the generation process. The rules are like these for normal VampirTrace instrumentation, where only 0 (exclude functions) and -1 (generally include functions) are allowed.

The second step is to compile the generated source file:

vtlibwrapgen --build --shared -o libSDLwrap SDLwrap.c

This builds the shared library libSDLwrap.so, which can be linked to the application or preloaded by using the environment variable LD PRELOAD:

LD\_PRELOAD=$PWD/libSDLwrap.so <executable>

Runtime Measurement

Running a VampirTrace instrumented application should normally result in an OTF trace file in the current working directory where the application was executed. If a problem occurs, set the environment variable VT_VERBOSE to 2 before executing the instrumented application in order to see control messages of the VampirTrace runtime system which might help tracking down the problem.

The internal buffer of VampirTrace is limited to 32 MB per process. Use the environment variables VT_BUFFER_SIZE and VT_MAX_FLUSHES to increase this limit.

Trace File Name and Location

The default name of the trace file depends on the operating system where the application is run. On Linux, MacOS and Sun Solaris, the trace file will be named like the application, e.g., hello.otffor the executable hello. For other systems, the default name is a.otf. Optionally, the trace file name can be defined manually by setting the environment variable VT_FILE_PREFIX to the desired name. The suffix .otf will be added automatically.

To prevent overwriting of trace files by repetitive program runs, one can enable unique trace file naming by setting VT_FILE_UNIQUE to yes. In this case, VampirTrace adds a unique number to the file names as soon as a second trace file with the same name is created. A *.lock file is used to count up the number of trace files in a directory. Be aware that VampirTrace potentially overwrites an existing trace file if you delete this lock file. The default value of VT_FILE_UNIQUE is no. You can also set this variable to a number greater than zero, which will be added to the trace file name. This way you can manually control the unique file naming.

The default location of the final trace file is the working directory at application start time. If the trace file will be stored in another place, use VT_PFORM_GDIR to change the location of the trace file.

Environment Variables

Environment variables can be used to control nearly every aspect of the measurement of a VampirTrace instrumented executable. (ToDo: link to CheatSheet and Doku-PDF)

records are stored, before being written to a file.
  • 32M
    • VT_CLEAN
    • Remove temporary trace files?
    • yes
    • VT_COMPRESSION
    • Write compressed trace files?
    • yes
    • VT_FILE_PREFIX
    • Prefix used for trace filenames.
    • VT_FILE_UNIQUE
    • Enable unique trace file naming? Set to yes, no, or a numerical ID.
    • no
    • VT_MAX_FLUSHES
    • Maximum number of buffer flushes.
    • 1
    • VT_MAX_THREADS
    • Maximum number of threads per process that VampirTrace reserves resources for.
    • 65536
    • VT_PFORM_GDIR
    • Name of global directory to store final trace file in.
    • ./
    • VT_PFORM_LDIR
    • Name of node-local directory which can be used to store temporary trace
files.
  • /tmp/
    • VT_UNIFY
    • Unify local trace files afterwards?
    • yes
    • VT_VERBOSE
    • Level of VampirTrace related information messages: Quiet (0), Critical
(1), Information (2)
  • 1
    • Optional Features
    • VT_CPUIDTRACE
    • Enable tracing of CPU ID?
    • no
    • VT_ETIMESYNC
    • Enable enhanced timer synchronization? ⇒ Section
[#timer_synchronization [*]]
  • no
    • VT_ETIMESYNC_INTV
    • Interval between two successive synchronization phases in s.
    • 120
    • VT_IOLIB_PATHNAME
    • Provides an alternative library to use for LIBC I/O calls.
    • VT_IOTRACE
    • Enable tracing of application I/O calls?
    • no
    • VT_LIBCTRACE
    • Enable tracing of fork/system/exec calls?
    • yes
    • VT_MEMTRACE
    • Enable memory allocation counter?
    • no
    • VT_MODE
    • Colon-separated list of VampirTrace modes: Tracing (TRACE), Profiling
(STAT).
  • TRACE
    • VT_MPICHECK
    • Enable MPI correctness checking via UniMCI?
    • no
    • VT_MPICHECK_ERREXIT
    • Force trace write and application exit if an MPI usage error is
detected?
  • no
    • VT_MPITRACE
    • Enable tracing of MPI events?
    • yes
    • VT_PTHREAD_REUSE
    • Reuse IDs of terminated Pthreads?
    • yes
    • VT_STAT_INV
    • Length of interval for writing the next profiling record
    • 0
    • VT_STAT_PROPS
    • Colon-separated list of event types that will be recorded in profiling

mode: Functions (FUNC), Messages (MSG), Collective Ops. (COLLOP) or all of them (ALL)

  • ALL
    • VT_SYNC_FLUSH
    • Enable synchronized buffer flush?
    • no
    • VT_SYNC_FLUSH_LEVEL
    • Minimum buffer fill level for synchronized buffer flush in percent.
    • 80
    • Counters
    • VT_METRICS
    • Specify counter metrics to be recorded with trace events as a
colon-separated list of names
    • VT_RUSAGE
    • Colon-separated list of resource usage counters which will be recorded.
    • VT_RUSAGE_INTV
    • Sample interval for recording resource usage counters in ms.
    • 100
    • Filtering, Grouping
    • VT_DYN_BLACKLIST
    • Name of blacklist file for Dyninst instrumentation.
    • VT_DYN_SHLIBS
    • Colon-separated list of shared libraries for Dyninst instrumentation.
    • VT_FILTER_SPEC
    • Name of function/region filter file.
    • VT_GROUPS_SPEC
    • Name of function grouping file.
    • VT_JAVA_FILTER_SPEC
    • Name of Java specific filter file.
    • VT_GROUP_CLASSES
    • Create a group for each Java class automatically?
    • yes
    • VT_MAX_STACK_DEPTH
    • Maximum number of stack level to be traced. (0 = unlimited)
    • 0
    • Demangle, Symbol List
    • VT_GNU_DEMANGLE
    • Decode (demangle) low-level symbol names into user-level names?
    • no
    • VT_GNU_GETSRC
    • Retrieve the source code line of functions instrumented automatically
with the GNU interface?
  • yes
    • VT_GNU_NMFILE
    • Name of file with symbol list information.

When you use these environment variables, make sure that they have the same value for all processes of your application on all nodes of your cluster. Some cluster environments do not automatically transfer your environment when executing parts of your job on remote nodes of the cluster, and you may need to explicitly set and export them in batch job submission scripts.

Influencing Trace Buffer Size

The default values of the environment variables VT_BUFFER_SIZE and VT_MAX_FLUSHES limit the internal buffer of VampirTrace to 32 MB per process, and the number of times that the buffer is flushed to 1, respectively. Events that are to be recorded after the limit has been reached are no longer written into the trace file. The environment variables apply to every process of a parallel application, meaning that applications with n processes will typically create trace files n times the size of a serial application.

To remove the limit and get a complete trace of an application, set VT_MAX_FLUSHES to 0. This causes VampirTrace to always write the buffer to disk when it is full. To change the size of the buffer, use the environment variable VT_BUFFER_SIZE. The optimal value for this variable depends on the application which is to be traced. Setting a small value will increase the memory available to the application, but will trigger frequent buffer flushes by VampirTrace. These buffer flushes can significantly change the behavior of the application. On the other hand, setting a large value, like 2G, will minimize buffer flushes by VampirTrace, but decrease the memory available to the application. If not enough memory is available to hold the VampirTrace buffer and the application data, parts of the application may be swapped to disk, leading to a significant change in the behavior of the application.

Note that you can decrease the size of trace files significantly by using the runtime function filtering.

Profiling an Application

Profiling an application collects aggregated information about certain events during a program run, whereas tracing records information about individual events. Profiling can therefore be used to get a summary of the program activity and to detect events that are called very often. The profiling information can also be used to generate filter rules to reduce the trace file size.

To profile an application, set the variable VT_MODE to STAT. Setting VT_MODE to STAT:TRACE tells VampirTrace to perform tracing and profiling at the same time. By setting the variable VT STAT PROPS, the user can influence whether functions, messages, and/or collective operations shall be profiled.

Unification of Local Traces

After a run of an instrumented application, the traces of the single processes need to be unified in terms of timestamps and event IDs. In most cases, this happens automatically. If the environment variable VT_UNIFY is set to no, and in the case of certain other circumstances, it will be necessary to perform unification of local traces manually. To do this, use the following command:

vtunify <nproc> <prefix>

If VampirTrace was built with support for OpenMP and/or MPI, it is possible to speedup the unification of local traces significantly. To distribute the unificationon multible processes, the MPI parallel version vtunify-mpi can be used as follows:

mpirun -np <nranks> vtunify-mpi <nproc> <prefix>

Furthermore, both tools vtunify and vtunify-mpi are capable of opening additional OpenMP threads for unification. The number of threads can be specified by the OMP_NUM_THREADS environment variable.

Synchronized Buffer Flush

When tracing an application, VampirTrace temporarily stores the recorded events in a trace buffer. Typically, if a buffer of a process or thread has reached its maximum fill level, the buffer has to be flushed and other processes or threads may have to wait for this process or thread. This will result in an asynchronous runtime behavior.

To avoid this problem, VampirTrace provides a buffer flush in a synchronized manner. This means that if one buffer has reached its minimum buffer fill level VT_SYNC_FLUSH_LEVEL, all buffers will be flushed. This buffer flush is only available at appropriate points in the program flow. Currently, VampirTrace makes use of all MPI collective functions associated with MPI_COMM_WORLD. Use the environment variable VT_SYNC_FLUSH to enable synchronized buffer flush.

Enhanced Timer Synchronization

Especially on cluster environments, where each process has its own local timer, tracing relies on precisely synchronized timers. Therefore, VampirTrace provides several mechanisms for timer synchronization. The default synchronization scheme is a linear synchronization at the very beginning and very end of a trace run with a master-slave communication pattern.

However, this way of synchronization can become too imprecise for long trace runs. Therefore, we recommend the usage of the enhanced timer synchronization scheme of VampirTrace. This scheme inserts additional synchronization phases at appropriate points in the program flow. Currently, VampirTrace makes use of all MPI collective functions associated with MPI_COMM_WORLD.

To enable this synchronization scheme, a LAPACK library with C wrapper support has to be provided for VampirTrace, and the environment variable VT_ETIMESYNC has to be set before the tracing. The length of the interval between two successive synchronization phases can be adjusted with VT_ETIMESYNC_INTV. The following LAPACK libraries provide a C-LAPACK API that can be used by VampirTrace for the enhanced timer synchronization:

  • CLAPACK
  • AMD ACML
  • IBM ESSL
  • Intel MKL
  • SUN Performance Library

Note: Systems equipped with a global timer do not need timer synchronization.

Note: It is recommended to combine enhanced timer synchronization and synchronized buffer flush.

Note: Be aware that the asynchronous behavior of the application will be disturbed since VampirTrace makes use of asynchronous MPI collective functions for timer synchronization and synchronized buffer flush. Only make use of these approaches if your application does not rely on an asynchronous behavior! Otherwise, keep this fact in mind during the process of performance analysis.

Recording Additional Events and Counters

Hardware Performance Counters

If VampirTrace has been built with hardware counter support, it is capable of recording hardware counter information as part of the event records. To request the measurement of certain counters, the user is required to set the environment variable VT_METRICS. The variable should contain a colon-separated list of counter names or a predefined platform-specific group.

The user can leave the environment variable unset to indicate that no counters are requested. If any of the requested counters are not recognized or the full list of counters cannot be recorded due to hardware resource limits, program execution will be aborted with an error message.

PAPI Hardware Performance Counters

If the PAPI library is used to access hardware performance counters, metric names can be any PAPI preset names or PAPI native counter names. For example, set

VT\_METRICS=PAPI\_FP\_OPS:PAPI\_L2\_TCM

to record the number of floating point instructions and level 2 cache misses.

Resource Usage Counters

The Unix system call getrusage provides information about consumed resources and operating system events of processes such as user/system time, received signals, and context switches.

If VampirTrace has been built with resource usage support, it is able to record this information as performance counters to the trace. You can enable tracing of specific resource counters by setting the environment variable VT_RUSAGE to a colon-separated list of counter names. For example, set

VT\_RUSAGE=ru\_stime:ru\_majflt

to record the system time consumed by each process and the number of page faults. Alternatively, one can set this variable to the value all to enable recording of all 16 resource usage counters. Note that not all counters are supported by all Unix operating systems. Linux 2.6 kernels, for example, support only resource information for six of them.

The resource usage counters are not recorded at every event. They are only read if 100 ms have passed since the last sampling. The interval can be changed by setting VT_RUSAGE_INTV to the number of desired milliseconds. Setting VT_RUSAGE_INTV to zero leads to sampling resource usage counters at every event, which may introduce a large runtime overhead. Note that in most cases the operating system does not update the resource usage information at the same high frequency as the hardware performance counters. Setting VT_RUSAGE_INTV to a value less than 10 ms does not usually improve the granularity.

Be aware that, when using the resource usage counters for multi-threaded programs, the information displayed is valid for the whole process and not for each single thread.

Memory Allocation Counter

The GNU LIBC implementation provides a special hook mechanism that allows intercepting all calls to memory allocation and free functions (e.g. malloc, realloc, free). This is independent from compilation or source code access, but relies on the underlying system library.

If VampirTrace has been built with memory-tracing support, VampirTrace is capable of recording memory allocation information as part of the event records. To request the measurement of the application’s allocated memory, the user must set the environment variable VT_MEMTRACE to yes.

Note: This approach to get memory allocation information requires changing internal function pointers in a non-thread-safe way, so VampirTrace currently does not support memory tracing for threadable programs, e.g., programs parallelized with OpenMP or Pthreads!

Pthread API Calls

When tracing applications with Pthreads, only user events and functions are recorded which are automatically or manually instrumented. Pthread API functions will not be traced by default. To enable tracing of all C-Pthread API functions, include the header vt user.h and compile the instrumented sources with -DVTRACE PTHREAD.

C/C++

#include "vt\_user.h"

vtcc **-DVTRACE\_PTHREAD** hello.c -o hello

I/O Calls

Calls to functions which reside in external libraries can be intercepted by implementing identical functions and linking them before the external library. Such “wrapper functions” can record the parameters and return values of the library functions.

If VampirTrace has been built with I/O tracing support, it uses this technique for recording calls to I/O functions of the standard C library, which are executed by the application. The following functions are intercepted by VampirTrace:

The gathered information will be saved as I/O event records in the trace file. This feature has to be activated for each tracing run by setting the environment variable VT_IOTRACE to yes.

This works for both dynamically and statically linked executables. Note that when linking statically, a warning like the following may be issued: Using “dlopen” in statically linked applications requires at runtime the shared libraries from the glibc version used for linking. This is ok as long as the mentioned libraries are available for running the application.

If you’d like to experiment with some other I/O library, set the environment variable VT_IOLIB_PATHNAME to the alternative one. Beware that this library must provide all I/O functions mentioned above; otherwise VampirTrace will abort.

fork/system/exec Calls

If VampirTrace has been built with LIBC trace support, it is capable of tracing programs which call functions from the LIBC exec family (execl, execlp, execle, execv, execvp, execve), system, and fork. VampirTrace records the call of the LIBC function to the trace. This feature works for sequential (i.e., no MPI or threaded parallelization) programs only. It works for both dynamically and statically linked executables. Note that when linking statically, a warning like the following may be issued: Using “dlopen” in statically linked applications requires at runtime the shared libraries from the glibc version used for linking. This is ok as long as the mentioned libraries are available for running the application.

When VampirTrace detects a call of an exec function, the current trace file is closed before executing the new program. If the executed program is also instrumented with VampirTrace, it will create a different trace file. Note that VampirTrace aborts if the exec function returns unsuccessfully. Calling fork in an instrumented program creates an additional process in the same trace file.

MPI Correctness Checking Using UniMCI

VampirTrace supports the recording of MPI correctness events, e.g., usage of invalid MPI requests. This is implemented by using the Universal MPI Correctness Interface (UniMCI), which provides an interface between tools like VampirTrace and existing runtime MPI correctness checking tools. Correctness events are stored as markers in the trace file and are visualized by Vampir. If VampirTrace is built with UniMCI support, the user only has to enable MPI correctness checking. This is done by merely setting the environment variable VT_MPICHECK to yes. Further, if your application crashes due to an MPI error you should set VT_MPICHECK_ERREXIT to yes. This environmental variable forces VampirTrace to write its trace to disk and exit afterwards. As a result, the trace with the detected error is stored before the application might crash.

To install VampirTrace with correctness checking support, it is necessary to have UniMCI installed on your system. UniMCI in turn requires you to have a supported MPI correctness checking tool installed (currently only the tool Marmot is known to have UniMCI support). So, all in all, you should use the following order to install with correctness checking support:

  1. Marmot

http://www.hlrs.de/organization/av/amt/research/marmot

  1. UniMCI

http://www.tu-dresden.de/zih/unimci

  1. VampirTrace

http://www.tu-dresden.de/zih/vampirtrace

Information on how to install Marmot and UniMCI is given in their respective manuals. VampirTrace will automatically detect an UniMCI installation if the unimci-config tool is in path.

User-defined Counters

In addition to the manual instrumentation, the VampirTrace API provides instrumentation calls which allow recording of program variable values (e.g., iteration counts, calculation results, ...) or any other numerical quantity. A user-defined counter is identified by its name, the counter group it belongs to, the type of its value (integer or floating-point) and the unit that the value is quoted (e.g. “GFlop/sec”). The VT_COUNT_GROUP_DEF and VT_COUNT_DEF instrumentation calls can be used to define counter groups and counters:

Fortran

#include "vt\_user.inc"

integer :: id, gid

VT\_COUNT\_GROUP\_DEF(’name’, gid)

VT\_COUNT\_DEF(’name’, ’unit’, type, gid, id)

C/C++

#include "vt\_user.h"

unsigned int id, gid;

gid = VT\_COUNT\_GROUP\_DEF("name");

id = VT\_COUNT\_DEF("name", "unit", type, gid);

The definition of a counter group is optional. If no special counter group is desired, the default group “User” can be used. In this case, set the parameter gid of VT_COUNT_DEF() to VT_COUNT_DEFGROUP. The third parameter type of VT_COUNT_DEF specifies the data type of the counter value. To record a value for any of the defined counters, the corresponding instrumentation call VT_COUNT * VAL must be invoked.

Fortran:    
Type Count call Data Type
VT_COUNT_TYPE_INTEGER VT_COUNT_INTEGER_VAL integer (4 byte)
VT_COUNT_TYPE_INTEGER8 VT_COUNT_INTEGER8_VAL integer (8 byte)
VT_COUNT_TYPE_REAL VT_COUNT_REAL_VAL real
VT_COUNT_TYPE_DOUBLE VT_COUNT_DOUBLE_VAL double precision

The following example records the loop index i:

Fortran

#include “vt_user.inc”

program main

integer :: i, cid, cgid

VT_COUNT_GROUP_DEF(’loopindex’, cgid)

VT_COUNT_DEF(’i’, ’#’, VT_COUNT_TYPE_INTEGER, cgid, cid)

do i=1,100

    VT_COUNT_INTEGER_VAL(cid, i)

end do

end program main

C/C++

#include “vt_user.h”

int main() {

   unsigned int i, cid, cgid;

   cgid = VT_COUNT_GROUP_DEF(’loopindex’);

   cid = VT_COUNT_DEF(“i”, “#”, VT_COUNT_TYPE_UNSIGNED, cgid);

   for( i = 1; i <= 100; i++ ) {

       VT_COUNT_UNSIGNED_VAL(cid, i);

   }

   return 0;

}

For all three languages, the instrumented sources have to be compiled with -DVTRACE. Otherwise, the VT * calls are ignored. Optionally, if the sources contain further VampirTrace API calls and only the calls for user-defined counters will be disabled, then the sources have to be compiled with -DVTRACE_NO_COUNT in addition to -DVTRACE .

User-Defined Markers

In addition to the manual instrumentation, the VampirTrace API provides instrumentation calls which allow recording of special user information, which can be used to better identify parts of interest. A user-defined marker is identified by its name and type.

Fortran

#include "vt\_user.inc"

integer?:: mid

VT\_MARKER\_DEF(’name’, type, mid)

VT\_MARKER(mid, ’text’)

C/C++

#include "vt\_user.h"

unsigned int mid;

mid = VT\_MARKER\_DEF("name",type);

VT\_MARKER(mid, "text");

Types for Fortran/C/C++

?

VT_MARKER_TYPE_ERROR

VT_MARKER_TYPE_WARNING

VT_MARKER_TYPE_HINT

For all three languages, the instrumented sources have to be compiled with -DVTRACE. Otherwise, the VT * calls are ignored. Optionally, if the sources contain further VampirTrace API calls and only the calls for user-defined markers will be disabled, then the sources have to be compiled with -DVTRACE_NO_MARKER in addition to -DVTRACE .

Filtering and Grouping

By default, all calls of instrumented functions will be traced; consequently, the resulting trace files can easily become very large. In order to decrease the size of a trace, VampirTrace allows the specification of filter directives before running an instrumented application. The user can decide on how often an instrumented function/region should be recorded to a trace file. To use a filter, the environment variable VT_FILTER_SPEC needs to be defined. It should contain the path and name of a file with filter directives. Following is an example of a file containing filter directives:

#VampirTrace region filter specification

#

#call limit definitions and region assignments

#

#syntax: <regions> – <limit>

#

#regions  semicolon-separated list of regions

#         (can be wildcards)

#limit    assigned call limit

#         0 = region(s) denied

#        -1 = unlimited

#

add;sub;mul;div – 1000

* – 3000000

These region filter directives allow the functions add, sub, mul and div to be recorded at most 1000 times. The remaining functions * will be recorded at most 3,000,000 times.

Besides creating filter files manually, you can also use the vtfilter tool to generate them automatically. This tool reads a provided trace and decides whether a function should be filtered or not, based on the evaluation of certain parameters.

Rank Specific Filtering

An experimental extension allows rank specific filtering. Use @ clauses to restrict all following filters to the given ranks. The rank selection must be given as a list of <from> - <to> pairs or single values.

@ 4 - 10, 20 - 29, 34

foo;bar – 2000

* – 0

The example defines two limits for the ranks 4 - 10, 20 - 29, and 34.

Attention: The rank specific rules are activated later than usual at MPI Init, because the ranks are not available earlier. The special MPI routines MPI Init, MPI Init thread, and MPI Initialized cannot be filtered in this way.

Function Grouping

VampirTrace allows assigning functions/regions to a group. Groups can, for instance, be highlighted by different colors in Vampir displays. The following standard groups are created by VampirTrace:

Group name

Contained functions/regions

MPI

MPI functions

OMP

OpenMP API function calls

OMP_SYNC

OpenMP barriers

OMP_PREG

OpenMP parallel regions

Pthreads

Pthread API function calls

MEM

Memory allocation functions (⇒ Section [#mem_alloc_counter [*]])

I/O

I/O functions (⇒ Section [#io_calls [*]])

LIBC

LIBC fork/system/exec functions (⇒ Section [#execfork [*]])

Application

remaining instrumented functions and source code regions

Additionally, you can create your own groups, if, for example, you wish to better distinguish different phases of an application. To use function/region grouping, set the environment variable VT_GROUPS_SPEC to the path of a file which contains the group assignments. Below is an example of how to use group assignments:

# VampirTrace region groups specification

#

# group definitions and region assignments

#

# syntax: <group>=<regions>

#

# group       group name

# regions     semicolon-separated list of regions

#             (can be wildcards)

#

CALC=add;sub;mul;div

USER=app_*

These group assignments associate the functions add, sub, mul and div with group “CALC”, and all functions with the prefix app are associated with group “USER”.